Series Review
One of the early stages of creating any Power BI report is the development of the data model. The data model will consist of data tables, relationships, and calculations. There are two types of calculations: calculated columns, and measures.
Check out Power BI Row Context: Understanding the Power of Context in Calculations for key differences between calculated columns and measures.

Power BI Row Context: Understanding the Power of Context in Calculations
Row Context — What it is, When is it available, and its Implications
One of the most powerful elements of Power BI is that all measure calculations are done in context. The evaluation context limits the values in the current scope when evaluating an expression. The filter context and/or the row context make up the evaluation context.
Power BI Row Context: Understanding the Power of Context in Calculations of this series explores the row context in depth.
While Power BI Iterators: Unleashing the Power of Iteration in Power BI Calculations explores iterator functions, which are functions that create row context.

Power BI Iterators: Unleashing the Power of Iteration in Power BI Calculations
Iterator Functions — What they are and What they do
And finally, Power BI Filter Context: Unraveling the Impact of Filters on Calculations explores the concept of the filter context.

Power BI Filter Context: Unraveling the Impact of Filters on Calculations
Filter Context – How to create it and its impact on measures
When evaluating expressions, the row context can be transitioned into a filter context within Power BI. This transition can help create more complex measures. Row context, filter context, and context transition can be confusing when starting with DAX so visit references and documentation often.
This post is the fourth of a Power BI Fundamental series with a focus on the context transition. The example file used in this post is can be found on GitHub at the link below.

GitHub – Power BI Key Fundamentals
Power BI key fundamentals example files
Understanding Context Transition
The row context by itself does not filter data. Row context iterates through a table row-by-row. Context transition is when the row context transitions into the filter context. Context transition occurs with the CALCULATE() function and when the expression of an iterator function is a DAX measure.
The concept of context transition can be a bit abstract so it can be easiest to learn through examples. To explore, we will create a new calculated column in the Products table. The new ProductsSales calculates the total sales for each product and we define it as:
ProductSales =
SUM(SalesOrderDetail[SalesAmount])
After evaluating ProductSales we see it repeats the same $109.85M sales value for each row. This value is the total sales amount for the entire dataset. This is not what we want ProductSales to calculate, so what happened?
ProductSales calculates the total sales of the entire data rather than the filtered per-product value because row context is not a filter. For example, the row context includes the ProductID value but this identifier is not a filter on the data during evaluation. And because the row context is not a filter DAX does not distinguish between different rows (i.e products) when evaluating ProductSales.
For example, looking at the table above while evaluating the measure DAX does not distinguish the Adjustable Race row from the LL Crankarm row. Since all rows are viewed as the same the total sales value is repeated for each row.
You may have guessed it but, the example above calculates the wrong value because it does not contain a context transition. The row context does not shift to the filter context causing the error in the calculated value. This simple example highlights why context transition is important and when it’s needed. To correct this we must force the context transition. This will convert the row values into a filter and calculate the sales for each product. There are various ways to do this, and below are two options.
Option #1: The CALCULATE() Function
We can force context transition by wrapping ProductSales with the CALCULATE() function. To demonstrate we create a new ProductSales_calculate column. ProductSales_calculate is defined as:
ProductSales_calculate =
CALCULATE(
   SUM(SalesOrderDetail[SalesAmount])
)

This new calculated column shows the correct sales value for each product. We view the product type BK and can see now each row in the ProductSales_calculate column is different for each row.

Option #2: Using Measures
Within the data model, we have already created a measure SalesAmount2.
We defined SalesAmount2 as:
SalesAmount2 =
SUMX(
   SalesOrderDetail,
   SalesOrderDetail[OrderQty] * SalesOrderDetail[UnitPrice] * (1 -
   SalesOrderDetail[UnitPriceDiscount])
)
We can see by the expression SalesAmount2 uses the iterator function SUMX(). This measure calculates the sales amount row-by-row in the SalesOrderDetail table. As mentioned before context transition occurs within iterator functions. So rather than using CALCULATE() and SUM() we create another calculated column that references this measure.
ProductSales_measure = SalesAmount2
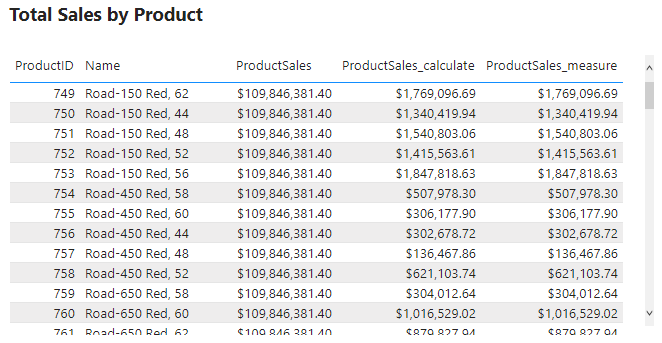
We add the new column to the table visual and can see that it has the same value as ProductSales_calculate. This shows that a measure defined with an iterator also forces context transition.
An important note about this new column is that the ProductsSales_measure works as expected when referencing the measure. However, it will not work if we define this column as the same expression that defines SalesAmount2.
We can see below if we update ProductSales_measure to:
SUMX(
   SalesOrderDetail,
  SalesOrderDetail[OrderQty] * SalesOrderDetail[UnitPrice] * (1 -
  SalesOrderDetail[UnitPriceDiscount])
)
The same expression used when defining SalesAmount2, will result in wrong values.
After updating ProductSales_measure we can see it returns the total sales values and not the sales per product. With this updated definition DAX is no longer able to apply the context transition. We can correct this by wrapping the expression with CALCULATE().
Applying context transition always requires CALCULATE()

Maximum Daily Sales by Month Example
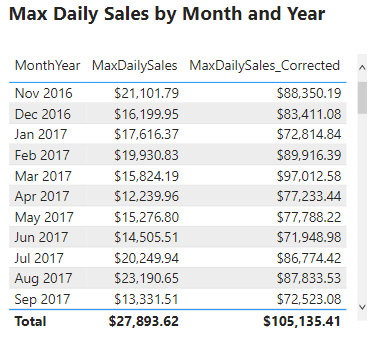
A question of interest is what is the maximum daily sales amount for each month in the dataset. In other words we would like to determine for each month what day of the month had the highest sales and what was the total daily sales value. We start by creating a new MaxDailySales measure and add it to the Max Daily Sales by Month and Year table visual.
We define MaxDailySales as:
MaxDailySales =
MAXX(SalesOrderDetail, [SalesAmount2])

After adding the measure to the table we can see the sales amount value for each month. For example, the table currently shows that the maximum daily sales for November 2016 is $21,202.79. This value may appear reasonable but when examined closely we can determine it is incorrect. Currently, MaxDailySales is returning the maximum sale for each month and is not accounting for multiple sales within each day. We can see this by creating a new visual with the Date, MaxSales, and SalesOrderDetailID fields.

This table shows that the MaxDailySales for November 2016 is the same value as a single sale that occurred on November 17th. Yet, there are multiple sales on this day and every other day. The desired outcome is to calculate the total sales for each day and then determined the highest daily total value for each month.
This error occurs because context transition is not being applied correctly. It is important to note that context transition is occurring while evaluating MaxDailySales because it is a measure. However, the context transition is not being applied on the correct aggregation level. The context transition is occurring on the SalesOrderDetail level, meaning for each row of this table. To correct this measure we will have to force the context transition on the correct, daily, aggregation level. We update the MaxDailySales expression using the VALUES() function.
We define MaxDailySales_Corrected as:
MaxDailySales_Corrected =
MAXX(
   VALUES(DateTable[Date]),
   [SalesAmount2]
)
We change the table passed to MAXX() from SalesOrderDetail to VALUES(DateTable[Date]). Using VALUES(DateTable[Date]) aggregates all the dates that are the same day shifting the context transition to the correct aggregation level. The VALUES() function in the expression provides a unique list of dates. For each day in the unique list, the SalesAmount2 measure gets evaluated and returns the maximum daily total value. We then add the new measure to the table visual and now it shows the correct maximum daily sales for each month.
The above example shows context transition at two different aggregation levels. They also highlight that the context transition can be shifted to return the specific value that is required. As well as showing why it is important to take into consideration the aggregation level when developing measures like MaxDailySales.
Context Transition Pit Falls
Context transition is when row values transition into or replace the filter context. When context transition occurs it can sometimes lead to unexpected and incorrect values. An important part of context transition to understand is that it transitions the entire row into the filter. So what occurs when a row is not unique? Let’s explore this with the following example.
We add a new SimplifiedSales table to the data model.

Then we add a TotalSales measure. TotalSales is defined as:
TotalSales =
SUMX(
   SimplifiedSales,
   SimplifiedSales[OrderQty] * SimplifiedSales[UnitPrice] * (1 -
   SimplifiedSales[UnitPriceDiscount])
)

Viewing the two tables above, we can confirm that the TotalSales values are correctly aggregating the sales data. Now we add another measure to the table which references the measure TotalSales. Referencing this measure will force context transition due to the implicit CALCULATE() added to measures. See above for details.
We define TotalSales_ConextT as:
TotalSales_ContextT =
SUMX(SimplifiedSales, [TotalSales])
In the new column we can see that the values for Road-350-W Yellow, 48 and Touring-3000 Blue, 44 have not changed and are correct. However, Mountain-500 Silver, 52 did update, and TotalSales_ContextT column shows an incorrect value. So what happened?
The issue is the context transition. Viewing the SimplifiedSales table we can see that Mountain-500 Silver, 52 appears twice in the table. With both records having identical values for each field. Remember, context transition utilizes the entire row. Meaning the table gets filtered on Mountain-500 Silver, 52/ 1/$450.00. Because of this, the result gets summed up in the TotalSales measure returning a value of $900.00. This value is then evaluated twice, once for each identical row.
This behavior is not seen for the Road-350-W, 48 records because they are unique. One row has a UnitPriceDiscount of 0.0% and the other has a value of 5.0%. This difference makes each row unique when context transition is applied.
When context transition occurs it is important to have some sort of unique identifier creating unique rows
Knowing what context transition is and when it occurs is important to identifying when this issue may occur. When context transition is applied it is important to check the table and verify calculations to ensure it is applied correctly.
Thank you for reading! Stay curious, and until next time, happy learning.

And, remember, as Albert Einstein once said, “Anyone who has never made a mistake has never tried anything new.” So, don’t be afraid of making mistakes, practice makes perfect. Continuously experiment and explore new DAX functions, and challenge yourself with real-world data scenarios.
If this sparked your curiosity, keep that spark alive and check back frequently. Better yet, be sure not to miss a post by subscribing! With each new post comes an opportunity to learn something new.
