Power Automate vs. Locked Files: A Smarter Way to Update Locked SharePoint Files


The Hidden Workflow Killer: Locked Files in SharePoint

Imagine you have created a Power Automate workflow for a document approval process that updates a status property of the document to keep end users informed. The workflow operates smoothly until you encounter failures, with an error message stating, “The file <file_path> is locked for shared use by <user_email>“.

This is a common issue encountered in workflows that update file metadata while users have the file open or during co-authoring. Without proper error handling, users may not even realize that the workflow has failed, which can lead to confusion and increased support requests to resolve the workflow problem.

A common solution to this problem involves checking whether the file is locked and repeatedly attempting to update it until the lock is released.

In this post, we will explore a more practical approach. Instead of waiting for the file lock to be released, we can detect the lock, extract the source control lock ID, and use it to update the file without any user intervention, even when the file is in use.


The Waiting Game: Why Do Until Loops Leave Everyone Hanging

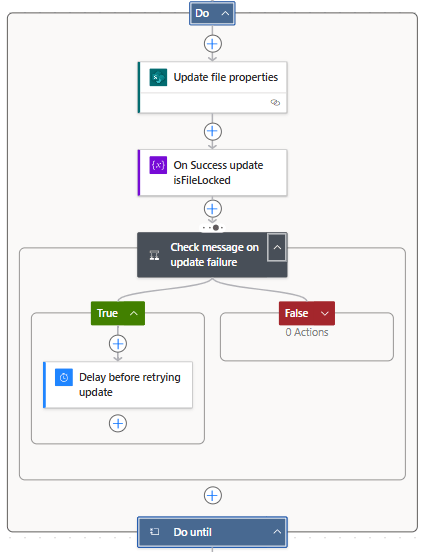
One workaround for a locked SharePoint file in Power Automate is to use a Do Until loop. The concept is straightforward: check if the file is locked, and if it is, use a delay action to wait before checking again. Repeat this process until the file becomes available. While it may not be the most elegant solution, it effectively gets the job done—at least sometimes.

Here is how this approach may look.

This process can be improved by identifying the user who has locked the file and sending them a notification to close it, allowing the workflow to continue. While this approach enhances the system, it still requires user intervention for the workflow to proceed.

In practice, this approach can be clunky. By default, it runs silently in the background and continues to loop without providing feedback to users. From their perspective, the workflow is broken. Users may attempt to retry the action, submit duplicate requests, or contact the workflow owner. When, in reality, the workflow is functioning as intended, it is simply waiting for the file to become available.

Even if notifications are sent to the user who has the file locked, the process still relies on that user to take action before it can proceed. If the user ignores the alert, is away or is out of the office, the process stalls. This type of automated update to file metadata should not depend on user action to function correctly.


The Upgrade: Skip the Wait and Update Locked Files Instantly

There is a more effective way to manage locked files without needing to retry failed updates or alert users to close their documents. Instead of waiting for SharePoint to release the lock, we can leverage some lesser-known features and properties of the files.

The key component of this approach is the LockedByUser file property. We can send an HTTP request to SharePoint using the lockedByUser endpoint to determine if the file is locked and by whom. More importantly, SharePoint also maintains a source control lock ID that can be used to override the lock in specific scenarios.

The process operates as follows: The workflow first checks if the file is locked by inspecting the lockedByUser response. If the file is locked, the workflow extracts the lock ID and then updates the file by passing the lock ID to SharePoint. If the file is not locked, it is updated as usual.

This method allows users to bypass waiting on the workflow. The file metadata is updated seamlessly, and the workflow moves to its subsequent actions.

Step-by-Step Guide to Implementing the New Approach

This method may seem technical, and while it is more complex than the Do until loop workaround, it is more straightforward than you might think.

Here is the workflow overview.

Get the file properties

The workflow starts by using the Get file properties action to retrieve all the properties of the file that triggered the workflow. We set the Site Address and Library Name and use dynamic content to select the ID from the selected file trigger.

Get lockedByUser Property

To retrieve the lockedByUser property value, we use the Send an HTTP request to SharePoint action. In this action, we set the Site Address to our SharePoint site and set the Method to GET. For the Uri, we use:

_api/web/lists('<documentlibrary_guid>')/items('<documentlibrary_itemId>')/File/lockedByUser

Finding the <documentlibrary_guid> for this action can be challenging. However, since we already have the Get file properties action, we can use Power Automate’s Code view to locate the required value.

Then, we use dynamic content for the <documentlibrary_itemId> to add the required ID value. Lastly, under Advanced parameters, we set the headers as follows:

{ 
   "Accept": "application/json;odata=nometadata", 
   "Content-Type": "application/json;odata=nometadata" 
}

Check the lockedByUser Response

When the file is locked, the response body of the HTTP request GET lockedByUser action indicates who has the file locked.

{
  "Id": 11,
  "IsHiddenInUI": false,
  "LoginName": "i:0#.f|membership|<user_email>",
  "Title": "<user_displayName>",
  "PrincipalType": 1,
  "Email": "<user_email>",
  "Expiration": "",
  "IsEmailAuthenticationGuestUser": false,
  "IsShareByEmailGuestUser": false,
  "IsSiteAdmin": false,
  "UserId": {
    "NameId": " ",
    "NameIdIssuer": " "
  },
  "UserPrincipalName": "<user_upn>"
}

The body contains the following information when the file is not locked.

{
  "odata.null": true
}

We use the odata.null property value in the Condition flow control to check if the file is locked.

We utilize the following function to include odata.null in the condition.

body('HTTP_request_GET_lockedByUser')?['odata.null']

Locked File Branch

If odata.null is not equal to true, our file is locked, and the workflow progresses down the True branch. We first need to obtain the source control lock ID to update the locked file.

You might be wondering where to find the lock ID. To view a list of file properties available within our workflow—beyond the basic properties returned by the Get file properties action—we add another Send an HTTP request to SharePoint action.

First, set the Site Address to our SharePoint site and choose “GET” as the Method. Then, use the following URI:

_api/web/lists('<documentlibrary_guid>')/items('<documentlibrary_itemId>')/File/Properties

*See the Get lockedByUser Property section to located <documentlibrary_guid> and <documentlibrary_itemId>

We can proceed to run a test of our workflow to examine the raw output of this request. In the output, we will see a list of available properties. The specific property we need is the value of vti_x005f_sourcecontrollockid.

Next, we will update the URI to select this particular property value.

_api/web/lists('<documentlibrary_guid>')/items('<documentlibrary_itemId>')/File/Properties?$select=vti_x005f_sourcecontrollockid

Once we have the required lock ID, we use another Send HTTP request to SharePoint action to perform the update. We set the Site Address to our SharePoint site and choose POST as the Method. Then, under the Advanced parameters, we select Show all to provide the necessary headers and body values.

For the Headers parameter, we use the following:

{ 
   "Accept": "application/json;odata=nometadata", 
   "Content-Type": "application/json;odata=nometadata" 
}

For the Body parameter, we will use:

{ 
   "formValues": [ 
      { 
         "FieldName": "ApprovalStatus", 
         "FieldValue": "In Process (Updated Locked File)" 
      } 
   ], 
   "sharedLockId": "body('HTTP_request_GET_sourcecontrollockid')?['vti_x005f_sourcecontrollockid']", 
   "bNewDocumentUpdate": true 
}

We dynamically utilize the lock ID within the Body parameter using this function.

body('HTTP_request_GET_sourcecontrollockid')?['vti_x005f_sourcecontrollockid']

Unlocked File Branch

If the file is not locked, we use the Send a HTTP request to SharePoint action to update the file. We configure the action the same way as the HTTP request used for the locked file, with the only difference being the body parameter.

Since the file is not locked, we do not include the sharedLockId property in the body parameter.

{ 
   "formValues": [ 
      { 
         "FieldName": "ApprovalStatus", 
         "FieldValue": "In Process (Updated Locked File)" 
      } 
   ], 
   "bNewDocumentUpdate": true 
}

Here is the workflow in action.

Continue the workflow with any Additional Actions

Once the update to the file metadata is complete, the workflow continues as usual. The file is updated directly, regardless of whether it is locked.

Although this approach requires some initial setup, once implemented, the workflow becomes more resilient and less dependent on unpredictable user behavior.


Wrapping Up

Locked SharePoint files can disrupt our Power Automate workflows, causing updates to stall and confusing users. Common fixes, such as using Do Until loops and notifications rely heavily on timing and user intervention.

The approach outlined here first checks if the file is locked. If it is, the method extracts the lock ID and sends an HTTP request to update the file with no retries or end-user intervention.

This workflow makes our workflow more efficient and reliable, enabling true automation without requiring any user action for the workflow to proceed.

Curious about the TRY Update document properties scope within the workflow?

Check out this post focused on Power Automate error handling and notifications.

Learn how to create a dynamic failure notification framework across Teams channels with a centralized SharePoint setup.


Thank you for reading! Stay curious, and until next time, happy learning.

And, remember, as Albert Einstein once said, “Anyone who has never made a mistake has never tried anything new.” So, don’t be afraid of making mistakes, practice makes perfect. Continuously experiment, explore, and challenge yourself with real-world scenarios.

If this sparked your curiosity, keep that spark alive and check back frequently. Better yet, be sure not to miss a post by subscribing! With each new post comes an opportunity to learn something new.

Explore Power BI Core Visualizations: Part 4 – Table and Matrix Visuals


Table and Matrix visuals in Power BI are essential for presenting detailed and structured data. Both visuals excel at displaying large amounts of information while highlighting trends, relationships, and hierarchies.

Tables offer a simple way to present data in a straightforward tabular format and are best for displaying detailed row-level data, such as sales records, inventory lists, or customer information. Unlike other visuals that summarize data at a high level, tables retain all details, making them an excellent tool for deep-dive analysis.

Matrix visuals enhance this capability by grouping and summarizing data hierarchically. Unlike tables that present data in a flat structure, matrix visuals allow for expandable rows. Users can then collapse or expand these groupings interactively to meet their needs.

Table and Matrix visuals are excellent for presenting data and hierarchical summaries, but they may not be suitable for every situation. It’s important to choose the right visual for effective reporting. To discover other essential visuals, check out Parts #1, #2, and #3 of the Explore Power BI Core Visualizations series.

Chart your data journey! Transform data into insights with Power BI core visualizations. 

Chart your data journey! Transform data into insights with Power BI core visualizations. 

Chart your data journey! Transform data into insights with Power BI core visualizations. 


Customizing Table Visuals

Table visuals in Power BI can be challenging to read and may become overwhelming if not formatted properly. Power BI offers a range of properties that allow us to customize our table visuals, enhancing readability, improving structure, and dynamically highlighting key insights.

Formatting the Table Layout

The fundamentals of formatting our table visuals involve customizing the grid, values, column headers, and totals properties. By adjusting these elements, we can enhance the appearance and clarity of our table visuals, making them more readable for our viewers.

The grid properties of our table visuals dictate how rows and columns are separated, providing a structured appearance.

We can toggle the horizontal and vertical gridlines on or off based on the requirements of the visual and the desired level of separation between rows and columns. Enabling the gridlines results in a structured layout, while disabling them offers a more minimalist design.

Additionally, the borders property allows us to define and apply borders to various sections of the table visual, including the column header, values section, and totals section.

In this example, we enable both the horizontal and vertical gridlines and set the bottom border of the column header section to an accent green color.

Next, we will focus on the Values property section. This area allows us to customize text styles and background colors, essential for ensuring our tables are readable and visually engaging.

We can specify the primary text color, background color, and alternate colors to differentiate between alternating rows in the visual. Alternating the styles of the rows improves readability and makes it easier to track values across each row.

The final basic formatting properties to consider are the column headers and totals. The column header properties allow us to adjust the font size, background color, and text alignment, which helps create a structured and easy-to-read table.

When we enable the Totals property, our table will include a row that aggregates the values from each column. We can customize this row’s font style, text color, and background color to distinguish it from the standard data rows.

In our example, we set the column headers to white with a dark blue background, making the header row easily identifiable. Additionally, we activate the totals row, giving it dark blue text, a gray background, and top and bottom borders to further differentiate it from the other data rows.

Enhancing Tables with Advanced and Conditional Formatting

In addition to basic formatting, Power BI provides multiple settings and options for advanced and conditional formatting, allowing for greater control over the appearance of table visuals. These options enable targeted formatting for specific columns and dynamic styling for key data points and trends.

We can utilize the specific column properties to apply unique formatting to individual columns, offering the flexibility to adjust the styling of headers, values, and total values for different series.

For example, we can include the count of transactions alongside our sales data in the table. Using the specific column properties, we can set the text color of the values and totals to visually distinguish them from the primary focus of the sales amounts.

The cell elements properties offer additional customization options and enable dynamic formatting. These customizations enhance our ability to highlight trends and identify key values.

For instance, using these properties, we can conditionally format the background and text color of the Sales Year-over-Year (YoY) series. This lets us quickly see which products have experienced growth or decline compared to the previous year.

We enable data bars for the current and last year’s sales series, visually comparing sales values across different products.

We also activate the icons feature for the current year’s sales values. We add a trending upward arrow for products whose current-year sales exceed those of the previous year and a downward arrow for products whose current-year sales are lower than last year’s. This visual representation quickly indicates product sales growth next to each product category and complements the Sales Year-over-Year series.

By integrating fundamental concepts, specific column formatting, cell elements, and conditional formatting, our Power BI table visuals can become dynamic and intuitive report elements that lead users to insights.


Customize Matrix Visuals

The Matrix visual in Power BI shares many of the same formatting options as the Table visual, including Grid, Values, Column headers, Specific column, and Cell elements formatting. However, Matrix visuals introduce additional formatting options for the hierarchical data structure.

Row Headers

Row headers are a key feature of Matrix visuals, allowing viewers to group and drill into the data. Power BI lets us define the font styling, text alignment, text color, and background color. We can also customize the size and color of the expand and collapse (+/-) buttons, or not show them all together.

Subtotals and Grand Totals

Row subtotals summarize data at each hierarchical level, allowing viewers to see how individual categories contribute to the overall total.

By toggling a setting in the Format options, we can enable or disable row subtotals. When row subtotals are enabled, we can customize the font and background styling and define the total label and its position.

In our example, we enable row subtitles and adjust the styling to ensure consistency with other visual elements. We then set the position of the subtotal to the bottom and activate the row-level settings. Under these settings, we select Product Code and label it as “Subtotal.” Next, we choose Product and label it “Grand Total.”

Grand totals display the final sum of all row and column values in our Matrix visuals. Proper formatting ensures these totals remain distinct and easy to locate.

The formatting options include font styling, font color, and background color.


Advanced Techniques and Customizations

The table and matrix visuals in Power BI provide a range of options for creating unique presentations that enhance data visualization, interactivity, and analytical depth. By designing these visuals thoughtfully, we can highlight key insights, delve deeper into our data, and create dynamic reports tailored to the viewers’ needs. Let’s explore some advanced examples that go beyond the basics.

Clean and Straightforward Sales Totals

This matrix visual presents a structured overview of our sales totals across different regions, product categories, and years. The clear and straightforward presentation makes analyzing trends over time and across regions easy.

We add a matrix visual to our report canvas to create this visual. Next, we place the Region and Product data into the Rows field, the Year into the Columns field, and a Total Sales measure into the Values field. After that, we expand all rows by one level and position the row subtotals at the bottom. Finally, we change the label for the Product row level label to Subtotal.

In the Layouts and Style Presets options, we set the Style to “None” and the Layout to “Outline.” We also toggled off the Repeat Row Headers option.

Under the Values properties, we adjust the background color and alternate background color to match the color of the matrix background.

Next, we format our column headers and the grand total section.

Column Headers:

  • Background color: matrix background color
  • Font color: dark blue font color
  • Font style: semi-bold and font size 11

Row/Column Grand Total:

  • Background color: a darker tone of the matrix background color
  • Font color: the same dark blue used for the values

To complete the visual, under the Cell elements properties, we enable data bars and set the positive bar color to a tone of the matrix background, ensuring that the bars and values are easy to read.

Month and Day of Week Sales Heat Map

We can use the Power BI matrix visual to create a heat map that visually displays sales performance across different days of the week and months. This heat map is created using the conditional formatting feature for cell elements, effectively highlighting patterns in our sales distribution.

We place a month name series in the rows field, a weekday name abbreviation series in the columns field, and a total sales measure in the values field.

Then, we toggle off the row and column subtotals.

To create a heat map, we start by enabling the background color property under the Cell elements section.

In the Background Color dialog box, we set the Format Style to gradient based on our Total Sales measure. Next, we add a middle color and set the colors for both the minimum and center values to match the matrix background, while the color for the maximum value is set to a dark blue. Including a middle color helps emphasize the top performances in the heat map.

Next, we enable the font color property under Cell elements.

In the Font Color dialog box, we set the Format Style to gradient based on our Total Sales measure. We then add a middle color and set both the minimum and maximum values to match the background color of the matrix. For the center value, we select a slightly darker shade. By setting these colors, we can hide values close to the minimum, gradually reveal values as they approach the maximum, and ensure that the light color of the maximum stands out against the dark blue background.

Product Review Ratings with Custom SVG Icons

This matrix visual uses custom SVG icons to show average product ratings by region, product, and product code.

We start by adding the Product and Product Code columns to the Rows fields, the Region column to the Columns field, three measures to the Values fields, and applying general formatting to the column headers.

The measures are:

Score SVG = 
VAR prefix = MAXX(FILTER(Icons, Icons[Name]="prefix"), Icons[SVGIcon])
VAR _00 = MAXX(FILTER(Icons, Icons[Name]="Satisfaction0.0"), Icons[SVGIcon])
VAR _05 = MAXX(FILTER(Icons, Icons[Name]="Satisfaction0.5"), Icons[SVGIcon])
VAR _10= MAXX(FILTER(Icons, Icons[Name]="Satisfaction1.0"), Icons[SVGIcon])
VAR _15= MAXX(FILTER(Icons, Icons[Name]="Satisfaction1.5"), Icons[SVGIcon])
VAR _20= MAXX(FILTER(Icons, Icons[Name]="Satisfaction2.0"), Icons[SVGIcon])
VAR _25= MAXX(FILTER(Icons, Icons[Name]="Satisfaction2.5"), Icons[SVGIcon])
VAR _30= MAXX(FILTER(Icons, Icons[Name]="Satisfaction3.0"), Icons[SVGIcon])
VAR _35= MAXX(FILTER(Icons, Icons[Name]="Satisfaction3.5"), Icons[SVGIcon])
VAR _40= MAXX(FILTER(Icons, Icons[Name]="Satisfaction4.0"), Icons[SVGIcon])
VAR _45= MAXX(FILTER(Icons, Icons[Name]="Satisfaction4.5"), Icons[SVGIcon])
VAR _50= MAXX(FILTER(Icons, Icons[Name]="Satisfaction5.0"), Icons[SVGIcon])

RETURN
SWITCH(
    TRUE(),
    [Average Score]<0.5, prefix&_00,
    [Average Score]>=0.5 && [Average Score]<1.0, prefix&_05,
    [Average Score]>=1.0 && [Average Score]<1.5, prefix&_10,
    [Average Score]>=1.5 && [Average Score]<2.0, prefix&_15,
    [Average Score]>=2.0 && [Average Score]<2.5, prefix&_20,
    [Average Score]>=2.5 && [Average Score]<3.0, prefix&_25,
    [Average Score]>=3.0 && [Average Score]<3.5, prefix&_30,
    [Average Score]>=3.5 && [Average Score]<4.0, prefix&_35,
    [Average Score]>=4.0 && [Average Score]<4.5, prefix&_40,
    [Average Score]>=4.5 && [Average Score]<=5.0, prefix&_50
)
Average Score = 
AVERAGE(Reviews[SatisfactionScore])
Review Count = 
COALESCE(COUNTROWS(Reviews), 0)

We enable column and row subtotals and format the grand totals section to visually distinguish it from the main data.

This visual enhances the user experience by making the review score data more intuitive to explore and understand.

These examples demonstrate how Power BI’s Table and Matrix visuals can be used and customized to improve our reports. By leveraging these visuals and the customization options they offer, we can create engaging, insightful, and easy-to-interpret reports.


Wrapping Up

Table and Matrix visuals in Power BI are effective tools for presenting structured data, whether through detailed tables or hierarchical matrices. By applying formatting and customization techniques, these visuals can transform our data and provide clear and intuitive insights.

Advanced features such as drill-down capabilities, cell element customization, and conditional formatting enhance these visuals beyond merely presenting numbers, making them more interactive and visually engaging. Table and Matrix visuals offer the flexibility to meet a variety of our reporting needs.

If you’d like to follow along and practice these techniques, sample data, and a Power BI report template file are available here: GitHub – EMGuyant Power BI Core Visuals.


Thank you for reading! Stay curious, and until next time, happy learning.

And, remember, as Albert Einstein once said, “Anyone who has never made a mistake has never tried anything new.” So, don’t be afraid of making mistakes, practice makes perfect. Continuously experiment, explore, and challenge yourself with real-world scenarios.

If this sparked your curiosity, keep that spark alive and check back frequently. Better yet, be sure not to miss a post by subscribing! With each new post comes an opportunity to learn something new.