Learn how to trigger Power BI dataset refreshes automatically using Power Automate when new files are added to SharePoint.
We have created a Power BI report that connects to a SharePoint folder where our team uploads new files every month. The process is simple: upload the file, refresh the report to incorporate the latest data, and then view the updated report.
But our users view the report, and then the messages begin “Is the report updated yet?” “Do I need to refresh it?
Manual refreshes could work, but it can also be challenging to manage and they are often overlooked. Scheduled refreshes present another option. However, they may not always be suitable. These refreshes occur on a fixed schedule, regardless of whether the data has changed. As a result, we may refresh too early and miss the new file, or we may refresh too late, leading users to view outdated information.
This post will explore an event-driven approach that aligns our report updates with the addition of new files.
With Power Automate, we can automatically trigger a dataset refresh when (and only when) a new file is added to our SharePoint source. This event-based refresh ensures our reports remain in sync with our data.
The Workflow
The Scenario
Let’s say we maintain a Power BI report that tracks product reviews. Each month, a CSV file is delivered, which the product team uploads to SharePoint. Once the file is uploaded, it is appended to our Power BI dataset, incorporating the reviews from the previous month.
The delivery and upload of files are manual processes that occur on the first weekday of each month. We could schedule the report refresh, but we need to determine the best frequency. Should we refresh it daily? If we do, we might refresh the report 30 times in a month without any new data. Alternatively, if we choose a weekly refresh, users may have to wait longer to access the latest information.
We will use Power Automate to monitor the SharePoint document library. By utilizing the When a new file is created trigger, the workflow starts automatically whenever a new file is added. This process refreshes the dataset and can even send a notification with a link to the updated report once it’s complete.
Build the Flow
The workflow is divided into three main sections: the trigger, refresh, and notification.
Trigger & Setup
We start with the When a file is created (properties only) SharePoint trigger, configured to the site and library where our file is uploaded. If necessary, we can utilize trigger conditions to prevent unnecessary refreshes.
The workflow uses two variables to verify that the refresh has completed before notifying users.
LastRefreshTime: tracks the current timestamp of the last dataset refresh.
RefreshRequestTime: stores the timestamp at which the flow starts the refresh.
Refresh the Dataset
We then use the Refresh a dataset Power BI action to trigger the report update. This action targets the specified workspace and dataset.
Note: the Power BI dataset includes a reference table called Last Refresh DateTime , which stores the timestamp (DateTimeZone.utcNow()) for when the dataset was last refreshed.
After initiating the refresh, we add a Do until loop that waits for the refresh to complete. The loop actions include:
Delay 30 seconds between checking the LastRefreshTime
Execute a query against the dataset to retrieve the Last Refresh DateTime value (DAX Query: EVALUATE Last Refresh DateTime)
Update the LastRefreshTim variable.
The loop repeats until the LastRefreshTime value is greater than the RefreshRequestTime.
Notify Users
After the refresh is complete, the workflow sends a confirmation email using the Send an email action. This email can be directed to the report owners or a shared inbox to confirm that the data is up to date. It can even include a link for users to view the report.
Tips for a More Reliable Setup
Here are some tips to enhance the reliability of our refresh automation.
Structure files consistently
Maintaining a consistent naming convention for files used in our automation reduces confusion and provides options for additional filtering within the workflow. It also simplifies our Power Query transformations.
Add retry logic and error handling
Delays and errors are inevitable, so it’s important to plan for them in advance. Incorporate branching or error-handling logic to notify the appropriate individuals when issues arise. For guidance on creating a dynamic failure notification system, see Elevate Power Automate Error Handling with Centralized Failure Notifications.
Keep the refresh lightweight
Avoid complex refresh dependencies. Preprocess large files or utilize staging tables to maintain the responsiveness and efficiency of our Power BI model.
Test with testing files first
Before automating production reports, upload sample files and verify the entire process to ensure accuracy. Confirm that the refresh timestamp updates correctly and that notifications are received as expected.
Try This Next
After automating our refresh process, the next step is to clean and shape the incoming data in a consistent and repeatable manner. Power Query parameters and functions simplify this task, enabling us to reuse common logic across different files. For instance, we can easily set data types, remove duplicates, and format text fields.
Manually refreshing datasets is only effective for a small number of reports serving a limited team. As our data expands and more users depend on timely insights, automation becomes crucial.
Scheduled refreshes are beneficial when new data arrives consistently or continuously. However, if our report data does not fit this scenario, scheduled refreshes will still run even if there are no updates to the data.
Our event-driven approach effectively addresses this scenario. Instead of estimating when to schedule updates, we implement a strategy that responds in real-time. By integrating SharePoint Online, Power BI, and Power Automate, we can create reliable and straightforward workflows that ensure our reports remain up-to-date and accurate.
Thank you for reading! Stay curious, and until next time, happy learning.
And, remember, as Albert Einstein once said, “Anyone who has never made a mistake has never tried anything new.” So, don’t be afraid of making mistakes, practice makes perfect. Continuously experiment, explore, and challenge yourself with real-world scenarios.
If this sparked your curiosity, keep that spark alive and check back frequently. Better yet, be sure not to miss a post by subscribing! With each new post comes an opportunity to learn something new.
Discover how to personalize your reports and show each user only the data they require in just a few clicks.
In the article Partial RLS Explained: Let Users See the Bigger Picture, we explored Partial RLS, a design pattern that allows users to view high-level context, such as company-wide totals, while still enforcing Row-Level Security (RLS) on detailed sales data.
Explore how to deliver personalized insights without losing the bigger picture.
We will now focus on another important aspect of data model security: Object-Level Security (OLS).
While RLS controls which rows within a table a user can access, OLS restricts visibility and interaction with specific tables and columns within the data model.
In this post, we will cover the following topics:
An overview of Object-Level Security (OLS)
A use case demonstrating how different user roles can view different data model objects
A step-by-step guide to implementing OLS
Key considerations and limitations
What is Object-Level Security
In Power BI, Object-Level Security (OLS) enables data modelers to restrict access to specific tables or columns based on the roles assigned to report viewers.
The key difference between RLS and OLS lies in what they restrict:
RLS controls which rows of data a user can access within a table.
OLS determines whether a user can see the table or specific columns.
OLS cannot be used to secure or hide measures directly. However, measures are impacted by OLS. If a measure references a column or table that is hidden for a specific role, the measure will also be automatically hidden for that role. It is important to consider this when designing experiences tailored to specific roles.
Power BI manages these data dependencies for us, ensuring that calculations based on secured data remain safe from exposure. However, there is a potential risk that some visuals in our report may not display correctly for viewers who do not have access to specific measures.
Use Case: Hide Reviews Tables and Sensitive Customer Columns
To examine and understand the value of OLS, let’s go through a scenario using a sample report.
We are developing a Power BI report for a sales organization. The data model includes two restricted areas:
The Reviews table contains product reviews from customers and their demographic information.
The Customers table includes several columns with customer details that should only be accessible to specific roles.
Access Requirements Access to the report is structured around four user roles.
The Regional Sales Basic role serves as the foundational level, providing minimal access. Users assigned this role can view sales data related to their sales region and basic customer information. They are restricted from viewing the Reviews table and the detailed customer information columns.
Next is the Regional Sales Advanced role. Users in this role have all the same access as Regional Sales Basic users but this role is able view the detailed customer information columns.
The Product Analyst role has access to the Reviews table but cannot view the detailed customer information columns. They can also view the sales and review data for any region they are assigned to.
Finally, there is the Leadership role. These users can see all the data for any region they are assigned.
Step-by-Step: Configure OLS in Power BI
After creating our data model and defining the tables and columns to which we plan to restrict access, we can begin configuring OLS.
To configure OLS, we will use the Tabular Editor Power BI external tool. There are many external tools for Power BI Desktop; visit Featured open-source tools to view a list of common and popular external tools.
Tabular Editor is a lightweight tool that allows us to build, maintain, and manage tabular models efficiently.
1) Create Roles in Power BI Desktop In Power BI Desktop, we navigate to the Modeling tab and select “Manage Roles.” We then create the four roles using the following DAX expression for RLS filtering on the User Access table. This table contains the user’s User Principal Name (UPN), region ID, and role for that region.
'User Access'[UPN] = USERPRINCIPALNAME()
2) Open Tabular Editor and Configure OLS We navigate to External tools in Power BI Desktop and then open Tabular Editor. Under Model, select Roles. The roles we created in Step 1 will appear.
We expand the Table Permissions to set the permissions for each role we want to configure OLS for.
None: OLS is enforced, and the table or column is hidden from that role.
Read: The table or column is visible to the role.
3) Secure Specific Tables To configure OLS for the Reviews table, we need to ensure that only users with the Product Analyst or Leadership roles have access to this table.
First, select the Reviews table and navigate to Object Level Security options under Translations, Perspectives, and Security. Set the permissions to “None” for the Regional Sales Basic and Regional Sales Advanced roles.
4) Secure Specific Columns Next, we secure the Address, PreferredContactMethod, and ContactInformation columns within the Customers table. To do this, we locate the Customers table and expand it to view its columns.
Then, we select each column we want to secure and set each role’s permissions under Object Level Security. For each column above, we set the permissions for the Regional Sales Basic and Product Analyst roles to None.
Once we finish configuring our OLS rules, we save the changes in Tabular Editor and then publish the semantic model to the Power BI service. Depending on our combination of RLS and OLS, testing within Power BI Desktop using the View as > Other user will not function as expected. We will test and validate our OLS rules in the Power BI Service.
Note: If using the sample report, before testing in the Power BI Service the UPN column within the User Access table will have to contain valid user UPNs.
5) Assign Users to Roles in the Power BI Service To add users to a role in the Power BI Service, we need to navigate to the workspace where the semantic model has been published. First, locate the semantic model, click on the “More options” ellipsis (…), and then select “Security.”
In the Row-Level Security screen, we can add users or security groups to each role we’ve created.
We have four users to test the OLS (with RLS) implementation:
Talia Norridge: Leadership role for all regions
Lena Marwood: Product Analyst for Europe and Asia regions
Jasper Kellin: Regional Sales Advanced for North America
Elara Voss: Regional Sales Basic for Asia
6) Test OLS Implementation On the Security screen, we select the More options ellipsis (…) next to a role and then Test as role.
Then, at the top, we select Now viewing as and then Select a person to validate that the OLS rules function as expected.
Leadership Role When we view the report as Talia Norridge in the Leadership role, we can see that all the regional sales information is displayed in the data cards at the bottom.
We confirm that Talia also has access to the Reviews table by hovering over the sales by product bar chart. The tooltip for this visual contains measures based on the product review data (e.g. average review rating).
Next, we verify that Talia has access to detailed customer information by hovering over a customer in the sales by customer bar chart. The tooltip for this visual shows the customer’s name and contact information (ContactInformation is a secured column).
Product Analyst Role Reviewing the report as Lena Marwood in the Product Analyst role, we see that her assignment is limited to the Asia and Europe sales regions. As a result, the total sales value reflects only these regions, and the top performers on the North America data card are hidden.
We confirm that Lena can access the Reviews table by checking the sales by product tooltip, and we see that, like the Leadership role, the data appears as expected.
We confirm that Lena should not have access to detailed customer information. When we hover over the sales by customer visual, the tooltip shows an error when displaying the customer’s contact information.
The customer’s name is displayed without issue because this is not a secured column. However, Lena’s role does not have permission to access the ContactInformation column, which prevents the report from retrieving this data.
Regional Sales Advanced When we view the report as Jasper Kellin, who holds the Regional Sales Advanced role, we confirm that the sales data only reflects his assigned region.
Next, we check the tooltips that display the review data and detailed customer information.
We verify that the review data produces the expected error because Jasper cannot access the Reviews table. As a result, he is unable to access the entire table and any measures that depend on it, such as the Average Score.
The Average Score measure is defined using the following DAX expression.
Average Score = AVERAGE(Reviews[SatisfactionScore])
After reviewing the customer sales data, we confirm that the contact information is presented in the tooltip to Jasper without any errors.
Regional Sales Basic When we view the report as Elara Voss, who holds the Regional Sales Basic role, we confirm that the sales data only reflects their assigned region.
Next, we check the tooltips that display the review data and detailed customer information.
Both tooltips display the expected error since Elara does not have permissions to the Reviews table or the detailed customer information columns.
Considerations and Limitations
OLS in Power BI offers a robust layer of protection, but there are important limitations to consider before deploying it.
1) OLS applies only to users with the Viewer workspace role. Workspace members with Admin, Member, or Contributor roles have edit permissions on the semantic model, and OLS does not apply to them.
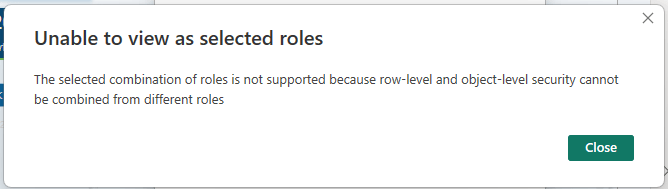
2) Combining OLS and RLS from different roles is not allowed; doing so may cause unintended access and generate an error.
3) Power BI automatically hides measures referencing a column or table restricted by OLS. Although Power BI does not offer a direct way to secure a measure, measures can be implicitly secured if they reference a secure table or column.
4) When users attempt to view visualizations dependent on a secured object with OLS configured, they encounter an error message. As a result, the report seems broken to these users. However, for specific roles this is expected. For example, the Regional Sales Basic role does not have permissions to the Reviews table, so it should not be available in the data set for these viewers.
BONUS: Mask Visual Errors and Control Page Navigation
When OLS hides a table or column, any visual that relies on that data will become unusable for users without access (refer to error message #4 above). While this error is anticipated, it may confuse users who might think the report is broken.
One possible workaround is to use a DAX measure and conditionally formatted shapes to cover the visual for users who cannot access the data.
In our sample report, we can create the following DAX measures to manage the visibility of the data on our tooltips.
We place a rectangle shape over the visuals that certain users cannot access, and then we conditionally format the fill color based on the measures.
It’s important to note that this is not an additional security layer or a replacement for OLS. This method only hides the error message to create a cleaner user experience.
However, this approach has a significant limitation. Our example works because the visuals underneath the shapes are not intended for user interaction. If the visuals are interactive for users with access to the data, the transparent shape overlay will prevent them from selecting or interacting with the visual. This means this workaround has a limited use case.
Certain design approaches can help manage which pages users can navigate to within a report. DAX-driven navigation buttons can create a user-friendly navigation experience, allowing users to navigate to the pages with data they have permission to view.
It’s important to note again that this approach does not provide security. However, it can help reduce the chances of users encountering error messages related to their access level based on typical report usage. Here is a brief walkthrough on this approach: RLS and OLS—Page Navigation.
While various design methods can enhance the user experience, OLS and RLS remain the only secure methods for controlling data access.
Wrapping Up
OLS in Power BI gives us a model-driven way to control access to specific tables and columns. Unlike Row-Level Security (RLS), which filters rows for authorized users, OLS prevents users from seeing certain objects of the model, removing entire tables and columns from the data experience.
When creating reports for broad audiences with different access needs, OLS can become essential to meet the requirements.
Thank you for reading! Stay curious, and until next time, happy learning.
And, remember, as Albert Einstein once said, “Anyone who has never made a mistake has never tried anything new.” So, don’t be afraid of making mistakes, practice makes perfect. Continuously experiment, explore, and challenge yourself with real-world scenarios.
If this sparked your curiosity, keep that spark alive and check back frequently. Better yet, be sure not to miss a post by subscribing! With each new post comes an opportunity to learn something new.
How to Update Locked SharePoint Files Without Loops or User Headaches
The Hidden Workflow Killer: Locked Files in SharePoint
Imagine you have created a Power Automate workflow for a document approval process that updates a status property of the document to keep end users informed. The workflow operates smoothly until you encounter failures, with an error message stating, “The file <file_path> is locked for shared use by <user_email>“.
This is a common issue encountered in workflows that update file metadata while users have the file open or during co-authoring. Without proper error handling, users may not even realize that the workflow has failed, which can lead to confusion and increased support requests to resolve the workflow problem.
A common solution to this problem involves checking whether the file is locked and repeatedly attempting to update it until the lock is released.
In this post, we will explore a more practical approach. Instead of waiting for the file lock to be released, we can detect the lock, extract the source control lock ID, and use it to update the file without any user intervention, even when the file is in use.
The Waiting Game: Why Do Until Loops Leave Everyone Hanging
One workaround for a locked SharePoint file in Power Automate is to use a Do Until loop. The concept is straightforward: check if the file is locked, and if it is, use a delay action to wait before checking again. Repeat this process until the file becomes available. While it may not be the most elegant solution, it effectively gets the job done—at least sometimes.
Here is how this approach may look.
This process can be improved by identifying the user who has locked the file and sending them a notification to close it, allowing the workflow to continue. While this approach enhances the system, it still requires user intervention for the workflow to proceed.
In practice, this approach can be clunky. By default, it runs silently in the background and continues to loop without providing feedback to users. From their perspective, the workflow is broken. Users may attempt to retry the action, submit duplicate requests, or contact the workflow owner. When, in reality, the workflow is functioning as intended, it is simply waiting for the file to become available.
Even if notifications are sent to the user who has the file locked, the process still relies on that user to take action before it can proceed. If the user ignores the alert, is away or is out of the office, the process stalls. This type of automated update to file metadata should not depend on user action to function correctly.
The Upgrade: Skip the Wait and Update Locked Files Instantly
There is a more effective way to manage locked files without needing to retry failed updates or alert users to close their documents. Instead of waiting for SharePoint to release the lock, we can leverage some lesser-known features and properties of the files.
The key component of this approach is the LockedByUser file property. We can send an HTTP request to SharePoint using the lockedByUser endpoint to determine if the file is locked and by whom. More importantly, SharePoint also maintains a source control lock ID that can be used to override the lock in specific scenarios.
The process operates as follows: The workflow first checks if the file is locked by inspecting the lockedByUser response. If the file is locked, the workflow extracts the lock ID and then updates the file by passing the lock ID to SharePoint. If the file is not locked, it is updated as usual.
This method allows users to bypass waiting on the workflow. The file metadata is updated seamlessly, and the workflow moves to its subsequent actions.
Step-by-Step Guide to Implementing the New Approach
This method may seem technical, and while it is more complex than the Do until loop workaround, it is more straightforward than you might think.
Here is the workflow overview.
Get the file properties
The workflow starts by using the Get file properties action to retrieve all the properties of the file that triggered the workflow. We set the Site Address and Library Name and use dynamic content to select the ID from the selected file trigger.
Get lockedByUser Property
To retrieve the lockedByUser property value, we use the Send an HTTP request to SharePoint action. In this action, we set the Site Address to our SharePoint site and set the Method to GET. For the Uri, we use:
Finding the <documentlibrary_guid> for this action can be challenging. However, since we already have the Get file properties action, we can use Power Automate’s Code view to locate the required value.
Then, we use dynamic content for the <documentlibrary_itemId> to add the required ID value. Lastly, under Advanced parameters, we set the headers as follows:
If odata.null is not equal to true, our file is locked, and the workflow progresses down the True branch. We first need to obtain the source control lock ID to update the locked file.
You might be wondering where to find the lock ID. To view a list of file properties available within our workflow—beyond the basic properties returned by the Get file properties action—we add another Send an HTTP request to SharePoint action.
First, set the Site Address to our SharePoint site and choose “GET” as the Method. Then, use the following URI:
_api/web/lists('<documentlibrary_guid>')/items('<documentlibrary_itemId>')/File/Properties

*See the Get lockedByUser Property section to located <documentlibrary_guid> and <documentlibrary_itemId>
We can proceed to run a test of our workflow to examine the raw output of this request. In the output, we will see a list of available properties. The specific property we need is the value of vti_x005f_sourcecontrollockid.
Next, we will update the URI to select this particular property value.
Once we have the required lock ID, we use another Send HTTP request to SharePoint action to perform the update. We set the Site Address to our SharePoint site and choose POST as the Method. Then, under the Advanced parameters, we select Show all to provide the necessary headers and body values.
If the file is not locked, we use the Send a HTTP request to SharePoint action to update the file. We configure the action the same way as the HTTP request used for the locked file, with the only difference being the body parameter.
Since the file is not locked, we do not include the sharedLockId property in the body parameter.
{
   "formValues": [
      {
         "FieldName": "ApprovalStatus",
         "FieldValue": "In Process (Updated Locked File)"
      }
   ],
   "bNewDocumentUpdate": true
}
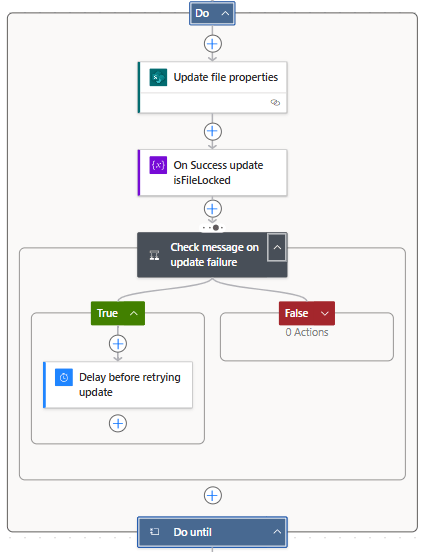
Here is the workflow in action.
Continue the workflow with any Additional Actions
Once the update to the file metadata is complete, the workflow continues as usual. The file is updated directly, regardless of whether it is locked.
Although this approach requires some initial setup, once implemented, the workflow becomes more resilient and less dependent on unpredictable user behavior.
Wrapping Up
Locked SharePoint files can disrupt our Power Automate workflows, causing updates to stall and confusing users. Common fixes, such as using Do Until loops and notifications rely heavily on timing and user intervention.
The approach outlined here first checks if the file is locked. If it is, the method extracts the lock ID and sends an HTTP request to update the file with no retries or end-user intervention.
This workflow makes our workflow more efficient and reliable, enabling true automation without requiring any user action for the workflow to proceed.
Curious about the TRY Update document properties scope within the workflow?
Check out this post focused on Power Automate error handling and notifications.
Learn how to create a dynamic failure notification framework across Teams channels with a centralized SharePoint setup.
Thank you for reading! Stay curious, and until next time, happy learning.
And, remember, as Albert Einstein once said, “Anyone who has never made a mistake has never tried anything new.” So, don’t be afraid of making mistakes, practice makes perfect. Continuously experiment, explore, and challenge yourself with real-world scenarios.
If this sparked your curiosity, keep that spark alive and check back frequently. Better yet, be sure not to miss a post by subscribing! With each new post comes an opportunity to learn something new.
Learn how to create a dynamic failure notification framework across Teams channels with a centralized SharePoint setup
Handling errors in Power Automate workflows can be challenging, especially when managing notifications across multiple flows. Adding contact details to each flow can become inefficient and difficult to maintain.
The Microsoft ecosystem offers various options and integrations to address these inefficiencies. In this approach, we will use a SharePoint list to centralize contact information, such as Teams Channel IDs and Teams Tag IDs. This method simplifies management and enhances our failure notification framework.
We will explore two methods. The first involves using Teams shared channels with @mentioning Teams tags to notify a specific group of users within our Power Automate Failure Notifications Teams team. The second method utilizes direct user @mentions in private Teams channels. Both methods employ a solution-aware flow, providing a reusable failure notification framework.
Power Automate Error Handling Best Practices
Before we can send failure notifications using our reusable framework, we first need to identify and handle errors within our workflows. It is essential to incorporate error handling into all our business-critical workflows to ensure that our Power Automate flows are resilient and reliable.
The configure run after setting is crucial for identifying the outcomes of actions within a workflow. It lets us know which actions were successful, failed, skipped, or timed out. By utilizing this feature, we can control how subsequent actions will behave based on the result of prior actions. Customizing these settings allows us to develop flexible and robust error-handling strategies.
Beyond using configure run after, there are important patterns that support effective error management in Power Automate:
Scoped Control (Try-Catch blocks): Grouping actions within the Scope control object aids in managing the outcomes of that set of actions. This method is valuable for isolating distinct parts of our workflow and handling errors effectively.
Parallel Branching: Establishing parallel branches enables certain workflow actions to continue even if others encounter errors. This approach allows us to run error-handling notifications or fallback actions concurrently with the primary process, enhancing the resilience of our flow and preventing interruptions.
Do Until Loop: For situations where actions may need multiple attempts to succeed, the Do Until control object permits us to execute actions until a specified success condition is met or a failure condition triggers our error-handling process.
These patterns collectively improve the reliability of our workflows by incorporating structured and consistent error handling. Identifying errors is just the first step; we must also notify the relevant individuals when a workflow encounters an issue so they can determine if further action or bug fixes are necessary.
Managing error notifications across multiple workflows can be difficult when contact information, such as an email address, is hardcoded into each individual flow. To address this, we will explore centralizing error notification details using a SharePoint list. This approach allows us to separate contact management from the flow logic and definitions.
The Final Solution in Action
Using Teams and Shared Channels with @mentioning Teams tags offers a practical and flexible solution. Teams tags enable us to group team members by their responsibilities, such as Development Team or workflow-specific groups. Using Teams tags makes it easy to alert an entire group using a single @mention tag.
In this example, we implement the Scoped Control (Try-Catch blocks) error handling pattern. This pattern groups a related set of actions into a scope, so if any action fails, we can handle the errors using an associated catch scope.
Here’s a basic flow that is triggered manually and attempts to list the members of a Teams Group chat.
When a non-existent Group chat ID is provided, the List members action will fail. This failure triggers the CATCH scope to execute. The CATCH scope is configured to run only when the TRY scope fails or times out.
When the CATCH scope executes, the flow filters the result of the TRY scope to identify which action failed or timed out using the following expressions:
Next, the flow utilizes the reusable notification framework to send a notification to Teams identifying that an error has occurred and providing details of the error message. We use the Run a Child Flow action and select our reusable error notification workflow for this purpose. This workflow requires three inputs:
When this workflow is triggered, and the TRY scope fails, we receive a Teams notification dynamically sent to the appropriate channel within our Power Automate Failure Notification Team, alerting the necessary individuals using the Dev Team Teams tag and direct @mentioning the technical contact.
The advantage of this approach and framework is that the notification solution only needs to be built once, allowing it to be reused by any of our solution-aware and business-critical workflows that require error notifications.
Additionally, we can manage the individuals alerted by managing the members assigned to each Teams tag or by updating the technical and functional contact details within our SharePoint list. All these updates can be made without altering the underlying workflow.
Continue reading for more details on how to set up and build this error notification framework. This post will cover how the Power Automate Failure Notifications Teams team was set up, provide resources on Teams tags, demonstrate how to create and populate a centralized SharePoint list for the required notification details, and finally, outline the construction of the failure notification workflow.
Setting Up Teams
Our error notification solution utilizes a private Microsoft Team, which can consist of both shared and private channels.
Shared channels are a convenient and flexible option for workflows that are not sensitive in nature. By using shared channels, we can take advantage of the List all tags Teams action to notify a group with a single @mention in our error notifications.
For additional information on managing and using Teams tags, see the resources below:
Private channels should be used when the workflow involves more sensitive information or when error notifications need to be restricted to a specific subset of team members. In this case, the error notifications target specific individuals by using direct user @mentions.
Centralized Error Notifications Details with SharePoint
To improve the maintainability of our error notifications, we will centralize the storage of key information using a SharePoint list. This approach enables us to store essential details, such as functional and technical contacts, Teams channel IDs, Teams Tag IDs, workflow IDs, and workflow names in one location, making it easy to reference this information in our error notification workflow.
The SharePoint list will serve as a single source for all required flow-related details for our notification system. Each entry in the list corresponds to a specific flow. This centralized repository minimizes the need for hardcoded values. When teams or contact details change, we can simply update the SharePoint list without the need to modify each individual flow.
Steps to Create the SharePoint List
Create a New List: In SharePoint, create a new list with a descriptive name and an appropriate description.
Add Required Columns: Include all necessary required and optional columns to the new SharePoint list.
FlowDisplayName: identifies the specific flow that utilizes the error notification system we are creating.
FlowId: unique identifier for the workflow associated with the error notification system.
Technical Contact: the primary person responsible for technical oversight who will be notified of any errors.
Functional Contact: secondary contact, usually involved in business processes or operational roles.
TeamsChannelName: name of the Teams Channel where error notifications will be sent.
TeamsChannelId: unique identifier for the Teams Channel that the flow uses to direct notifications.
TeamsTagId: this field is relevant only for shared channel notifications and contains the ID of the Teams Tag used to notify specific groups or individuals.
Populate the List with Flow Details
Our failure notification system will send alerts using the Post message in a chat or channel action. When we add this action to our flow, we can use the drop-down menus to manually select which channel within our Power Automate Failure Notifications team should receive the message.
However, it’s important to note that the Channel selection displays the channel name for convenience. Using the peak code option, we can see that the action utilizes the Channel ID.
The same applies when using the Get a @mention token for a tag. To dynamically retrieve the token, we need the Tag ID, not just the Tag name.
These key pieces of information are essential for our Failure Notification solution to dynamically post messages to different channels or @mention different tags within our Failure Notification team.
While there are various methods, such as peek code, to manually find the required values, this can become inefficient as the number of flows increases. We can streamline this process by creating a SharePoint Setup workflow within our Failure Notification solution.
This workflow is designed to populate the SharePoint list with the details necessary for the dynamic error notification framework. By automatically retrieving the relevant Teams channel information and Teams tag IDs, it ensures that all the required data is captured and stored in the SharePoint list for use in error notification flows.
SharePoint Set Up Workflow
This workflow has a manual trigger and allows us to run the setup as needed by calling it using the Run a Child Flow action when we want to add our error notifications to a workflow.
The inputs consist of 6 required string inputs and 1 optional string input.
channelDisplayName (required): the channel display name that appears in Teams. workflowId (required): the flow ID to which we add our error notifications. We can use the expression: workflow()?['name']. workflowDisplayName(required): the display name of the flow to which we are adding our error notifications. We can manually type in the name or use the expression: workflow()?['flowDisplayName']. technicalContact(required): the email for the technical contact. functionalContact (required): the email for the functional contact. workflowEnvironment (required): the environment the flow we are adding the error handling notifications to is running in. We can use the expression: workflow()?['tags']?['environmentName'] tagName (optional): the display name of the Teams tag, which is manually entered. This input is optional because the error notification solution can be used for Shared or Private Teams channels. However, @mentioning a Teams tag is only utilized for Shared channels.
Following the trigger, we initialize two string variables. The first ChannelId and the second TagId.
Get the Teams Channel ID
The next set of actions lists all the channels for a specified Team and uses the channelDisplayName input to extract the ID for the channel and set the ChannelId variable.
The Teams List channels action retrieves a list of all available channels in our Power Automate Failure Notifications Teams team. The Filter array action then filters this list based on the channelDisplayName input parameter.
The flow then attempts to set the ChannelId variable using the expression: outputs('Filter_array_to_input_teams_channel')['body'][0]?['id'].
However, if the output body of the Filter array action is empty, setting the variable will fail. To address this, we add an action to handle this failure and set the ChannelId to “NOT FOUND”. This indicates that no channel within our Power Automate Failure Notifications team matches the provided input value.
To achieve this, we use the Configure run after setting mentioned earlier in the post and set this action to execute only when the TRY Set ChannelId action fails.
Get the Teams Tag ID
After extracting the Teams Channel ID, the flow has a series of similar actions to extract the Tag ID.
Create an item on the SharePoint List
Lastly, the flow creates a new item on our supporting SharePoint list using the flow-specific inputs to store all the required information for our error notification solution.
Reusable Error Notification Flow Architecture
As the number of our workflows increases, a common challenge is developing a consistent and scalable error notification system. Instead of creating a new notification process for each workflow, we can leverage reusable solution-aware flows across multiple workflows within our environment. This approach minimizes duplication and streamlines our error notification processes.
Flow Structure for Reusable Notifications
The reusable notification flow is triggered when an error occurs in another workflow using the Run a Child Flow action and providing the required inputs.
The notification workflow parses the details of the workflow that encounters an error, creates an HTML table containing the details of the error that occurred, and then sends the notification using the centralized SharePoint list created in the previous section and dynamically alerts the appropriate individuals.
Trigger Inputs & Data Operations
We can catch and notify responsible parties that an error occurred in a workflow by calling this notification flow, using the Run a Child Flow action, and providing the workflowDetails, errorMessage, and scropeName.
After the trigger, we carry out two data operations. First, we parse the workflowDetails using the Parse JSON action and the expression json(triggerBody()?['text']) for the Content. Then, we create an HTML table using the information provided by our errorMessage input.
For the Create HTML table action, we use the following expressions for the inputs:
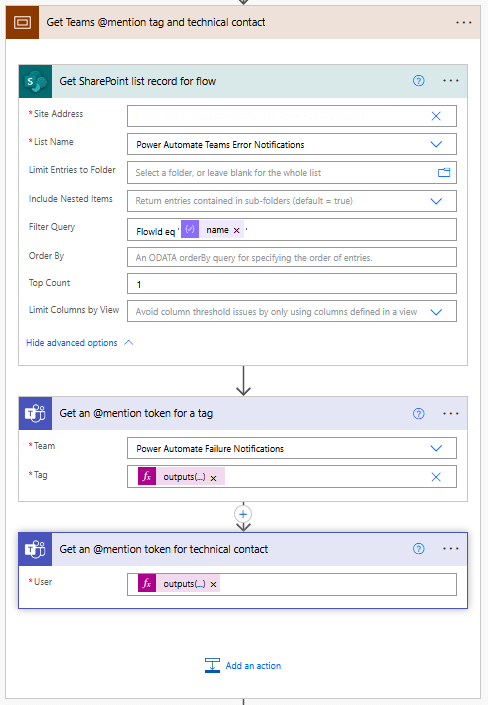
The notification flow queries the centralized SharePoint list to retrieve the necessary contact details and Teams information associated with the workflow that encountered the error.
We begin this subprocess by using the SharePoint Get items action with the Filter Query: FlowId eq 'body('Parse_workflowDetails_JSON')?['name']'.
Since each FlowID on our list should have only 1 record, we set the Top Count to 1.
Then, if our Power Automate Failure Notification Teams team uses Shared Channels, we use the Teams Get an @mention token for a tag and pass it the TagId stored within our SharePoint list using: outputs('Get_SharePoint_list_record_for_flow')?['body/value'][0]?['TagId'].
If the notification team uses private channels, this action can be excluded.
Lastly, for both Shared and Private channel notifications, we use the Teams Get an @mention token for user action to get the token for the technical contact stored within our SharePoint list using: outputs('Get_SharePoint_list_record_for_flow')?['body/value'][0]?['TechnicalContact']?['Email']
Send Teams Notification
Once we have retrieved the required contact details from SharePoint and Teams, the flow sends a notification to the appropriate Teams channel, notifying the relevant individuals. For Shared Channels, the message uses the @mention token for a Teams tag. If Private Channels are utilized, this should be removed from the flow and message.
Additionally, the message can be posted as the Flow bot when using Shared channels. However, when using Private channels, the message must be posted as User.
The flow dynamically sets the Channel using the ChannelId stored within our SharePoint list with the expression: outputs('Get_SharePoint_list_record_for_flow')?['body/value'][0]?['ChannelId'].
The message begins by identifying the workflow in which an error was encountered and the environment in which it is running.
Error reported in workflow: body('Parse_workflowDetails_JSON')?['tags']?['flowDisplayName'] {body('Parse_workflowDetails_JSON')?['tags']?['environmentName']}
Then, the message adds the HTML table created with the error message details using the following expression: body('Create_HTML_table_with_error_action_and_message').
Finally, it notifies the contacts for the workflow by using the @mention tokens for the Teams tag and/or the technical contact. The message also provides the details on the functional contact using the expression: outputs('Get_SharePoint_list_record_for_flow')?['body/value'][0]?['FunctionalContact']?['Email']
The notification process sends an informative and targeted message, ensuring all the appropriate individuals are alerted that an error has occurred within a workflow.
Reusability
This architecture enables us to develop a single workflow that can trigger error notifications for any new workflows, making our error handling and notification process scalable and more efficient.
By using this approach, we can avoid hardcoding notification logic and contact details in each of our workflows. Instead, we can centrally manage all error notifications. This reduces the time and effort needed to maintain consistent error notifications across multiple workflows.
Wrapping Up
This Power Automate error notification framework provides a scalable solution for managing notifications by centralizing contact information in a SharePoint list and leveraging solution-aware flows. Setting up a single, reusable notification flow eliminates the need to hardcode contact details within each workflow, making maintenance and updates more efficient.
The framework targeted two notification methods: Shared Teams channels with tags and Private Teams channels with direct mentions. This system ensures error notifications are delivered to the right individuals based on context and need.
Shared Channels with Teams Tags
This approach sends notifications to a shared Teams channel, with Teams tags allowing us to notify a group of individuals (such as a “Dev Team”) using a single @mention.
How It Works: The notification flow retrieves tag and channel details from the SharePoint list. It then posts the error notification to the shared channel, @mentioning the relevant Teams tag to ensure all tag members are alerted.
Advantages: This method is scalable and easy to manage. Team members can be added or removed from tags within Teams, so updates don’t require changes to the flow definition. This is ideal for notifying larger groups or managing frequent role changes.
Private Channels with Direct @Mentions
Private channels are used to send notifications directly alerting a technical contact when workflow and error details should not be visible to the entire Team.
How It Works: The flow dynamically retrieves contact details from the SharePoint list and posts the error notification to the private channel, mentioning the designated technical contact.
Advantages: This approach provides greater control over the visibility of the notifications, as access is restricted to only those users included in the private channel.
Each of these approaches is flexible and reusable across multiple workflows, simplifying the process of managing error notifications while ensuring messages reach the appropriate individuals based on the notification requirements.
Thank you for reading! Stay curious, and until next time, happy learning.
And, remember, as Albert Einstein once said, “Anyone who has never made a mistake has never tried anything new.” So, don’t be afraid of making mistakes, practice makes perfect. Continuously experiment, explore, and challenge yourself with real-world scenarios.
If this sparked your curiosity, keep that spark alive and check back frequently. Better yet, be sure not to miss a post by subscribing! With each new post comes an opportunity to learn something new.
Ever wondered how to tackle Power BI data challenges? Find out how I transformed this challenge into an opportunity to learn and then into an achievement.
Over the last two years I have ended each of my posts with two main messages, (1) stay curious and happy learning, and (2) continuously experiment, explore and challenge yourself. However, at times it can be hard to identify open ended opportunities to fulfill these.
One opportunity available is participating in various data challenges. I recently participated in and was a top 5 finalist in the FP20 Analytics ZoomCharts Challenge 15. This data challenge was a HR data analysis project with a provided dataset to explore and a chance to expand your report development skills.
What I enjoyed about the challenge is along with the dataset, it provided a series of questions to help guide the analysis and provide direction and a focus for the report.
Here is the resulting report submitted to the challenge and discussed in this post. View, interact, and get the PBIX file at the link below.
The report was built with the HR Analysis dataset and includes ZoomCharts custom Drill Down PRO visuals for Power BI.
About the Challenge
The FP20 Analytics challenge was in collaboration with ZoomCharts and provided an opportunity to explore custom Power BI ZoomCharts drill down visuals.
The requirements included developing a Power BI report with a default canvas size, a maximum of 2 pages, and include at least two ZoomCharts Drill Down Visuals.
The goal of the challenge was to identify trends within the dataset and develop a report that provides viewers the answers to the following questions.
How diverse is the workforce in terms of gender, ethnicity, and age?
Is there a correlation between pay levels, departments, and job titles?
How about the geographic distribution of the workforce?
What is the employee retention rate trend yearly?
What is the employee retention rate in terms of gender, ethnicity, and age?
Which business unit had the highest and lowest employee retention rate?
Which business unit and department paid the most and least bonuses annually?
What is the annual historical bonus trend? Can we show new hires some statistics?
How about the pay equity based on gender, ethnicity, and age?
What is the employee turnover rate (e.g., monthly, quarterly, annually) since 2017?
There are countless ways to develop a Power BI report to address these requirements. You can see all the FP20 Analytics ZoomCharts Challenge 15 report submissions here.
This post will provide an overview and some insight into my approach and the resulting report.
Understanding the Data
With any analysis project, before diving into creating the report, I started by exploring and getting an understanding of the underlying data. The challenge provided a single table dataset, so I loaded the data into Power BI to use the Power Query editor’s column distribution, column profile, and column quality to help get an understanding of the data.
Using these tools, I was able to identify missing values, data errors, data types, and get a better sense of the distribution of the data. This initial familiarity will help inform the analysis and help identify what data could be used to answer the requirement questions, identify data gaps, and help ask the right questions to create an effective report.
The dataset contained 16 columns and provided the following data on each employee.
Employee/Organizational characteristics
Employee ID, full name, job title, department, business unit, hire date, exit date
Demographic information
Age, gender, ethnicity
Salary information
Annual salary and bonus percentage
Location information
City, country, latitude, longitude
The dataset was already clean. No columns contained any errors that had to be addressed, and the only column that had empty/null values was exit date, which is expected. One thing I noted at this stage is that the Employee ID column did not provide a unique identifier for an employee.
Additionally, I used a temporary page in the Power BI report containing basic charts to visualize distributions and experiment with different types of visuals to see which ones best represent the data and help reach the report objectives. Another driver of using this approach was start experimenting with and understanding the different ZoomCharts and their customizations.
Identifying Key Data Attributes
Once I had a basic understanding of the dataset, it is always tempting to jump right into data manipulation and visualization. However, I find it helpful at this stage to pause and review the questions the report should answer.
During this review I was able to further define these goals, with my new understanding of the data, which guided the selection of relevant data within the dataset.
I then broke the questions down into 3 main areas of focus and began to think about what data attributes within the dataset can be used, and possibility more importantly, think about what is missing or how I can enrich the dataset to create a more effective report.
Workforce Diversity (Question #1 and #3)
To analyze the workforce diversity, the dataset provided a set of demographic information fields that aligned with these questions.
The next set of questions I focused on revolved around the salary and bonus structure of the organization. I identified I could use the demographic fields along with the salary information to provide insights.
Employee Retention & Turnover (Questions #4, #5, #6, and #10)
The dataset did not directly include the retention and turnover rates and required enriching the dataset to calculate these values. To do this I used the hire date and exit date. Once calculated I am able to add an organization context to the analysis by using the business unit, department, and job title attributes.
Dataset Enrichment
After identifying key data attributes that can be used to answer the objectives of the report, it becomes clear that there are opportunities for enriching the dataset to aid in making a more effective visualization (e.g. age bins) and address data gaps or require calculations (e.g. employee retention and turnover).
For this report I achieved this through the use of both calculated columns and measures.
Creating Calculated Columns
Calculated columns are a great tool to add new data based on existing information in the dataset. For this report I created 7 calculated columns which were required because I wanted to use the calculated result in axes of report visuals or as a filter condition in a DAX query.
Age Bin: categorized the employee’s age based on their age decade (20s, 30s, 40s, 50s, or 60s). Here I used a calculated column rather than the built-in data group option to provide more flexibility and control over the bins.
Tenure (Years): while exploring salary across departments and demographic categories, I also wanted to include context for how long the employee has been with the organization as this might influence their salary and/or bonus.
Total Compensation: the dataset provided annual salary and bonus percent. The bonus percent was helpful when examining this attribute specifically, however when analyzing the organization pay structure across groups, I found the overall page (salary + bonus) to be more insight and provide the entire picture of the employee’s compensation.
Employee Status: the dataset included current and past employees. To ease analysis and provide the users the ability to filter on the employee’s status I included a calculated column to label the employee as active or inactive.
Abbreviation: the report required providing insight broken down by business unit, country, and department all of which could have long names and clutter the report. For each of these columns I included a calculated column providing a 3-letter abbreviation to be used in the report visuals.
Defining Measures
In addition to calculated columns, the report included various calculated measures. These dynamic calculations are versatile and aid the interactive nature of the Power BI report.
For this report I categorized my measure into the following main categories.
Explicit Summaries: these measures are not strictly required. However, I prefer the use of explicit aggregation measures over implicit auto-aggregation measures on the visuals due to the increased flexibility and reusability.
Average Total Compensation
Average Bonus ($)
Average Bonus (%)
Highest Average Bonus % (Dept) Summary
Lowest Average Bonus % (Dept) Summary
Maximum Bonus %
Minimum Bonus %
Average Annual Salary
Maximum Annual Salary
Median Annual Salary
Minimum Annual Salary
Active Employee Count
Total count
Each ethnicity count
Male/Female count
Inactive Employee Count
Report Labels: these measures were used to add additional context and information to the user when interacting with drill down visuals. On the drill down visuals when a user selects a data category or data point the visual drills down and shows the next level of the data hierarchy. What is lost, is what top level category was selected, so these labels are used to provide that information.
Selected Age Bin
Selected Business Unit Retention
Selected Business Unit Turnover
Selected Dept Retention
Selected Dept Turnover
Retention & Turnover: 4 of the report objectives revolved around employee retention and turnover rates. The dataset only provided employee hire dates and exits which are used to calculate these values.
Cumulative Total Employee Count (used in retention rate)
Employee Separations (used in retention rate)
Employee Retention
Brazil Retention Rate
China Retention Rate
United Sates Retention Rate
Employee Turnover Rate
Brazil Turnover Rate
China Turnover Rate
United States Turnover Rate
Report Development
After understanding the dataset, identifying key data attributes, and enriching the dataset I moved onto the report development.
Report Framework
From the requirements I knew the report would be 2 pages. The first focused on Workforce Diversity and Salary & Bonus Structure. The second focused on Employee Retention & Turnover.
I started the report with a two-page template that included all the functionality of an expandable navigational element. For details on how I created this, and where to find downloadable templates see my post below.
This navigation is a compact vertical navigation that can be expanded to provide the user page titles and was highlighted as a strong point of the report in the Learn from the Best HR Reports: ZoomCharts TOP Picks.
User-Centric Design: Next level reporting with interactive navigation for an enhanced user experience
Then I selected the icons used in the navigation and updated the report page titles on each page and within the expanded navigation.
Once the template was updated for the specifics of this report, I applied a custom theme to get the aesthetic just right. For more on creating custom themes and where to find downloadable themes, including the one used in this report (twilight-moorland-plum), see the following post.
Dive into the details of blending design and data with custom Power BI themes.
After updating the navigation template and implementing the report theme, I was set with a solid foundation to begin adding report visuals.
Demographic & Compensation Analysis
The first page of the report focused on two main objectives, the demographic distribution of the workforce and an in-depth analysis of the organizational compensation structure.
Demographic Distribution
The first objective was to provide the user insights into the diversity of the workforce in terms of gender, ethnicity, and age. This was a perfect fit for the Drill Down Combo PRO (filter) by ZoomCharts visual. The visual displays the percentage of the workforce broken down by gender and displayed by employee age. Each age bin then can be drilled into to reveal additional insights into the age bins ethnicity make up.
In addition to the core visual, I included a card visual displaying the Selected Age Bin measure to provide context to the data when viewing an age bins ethnicity make up.
The Map visual shows the ethnicity of the workforce as a percentage of the total workforce for each geographic location.
This visual in the report had noted limitation. Mainly the initial view of the map did not show all the data available. The inclusion of the country break provided an effective means to filter to a specific country however, it crowded the visual. Additionally, the colors in the report for the ethnicity groups of Asian and Black used the same colors used throughout the report for Male and Female which can be a source of confusion. See the Feedback and Improvements sections to see the updates to more effectively visual this data.
The first component of the compensation structure analysis was to examine the median total compensation (salary + bonus) by departments, business units and job title. The second was to provide insights into compensation equity among the demographic groups of age, ethnicity, and gender.
I used the Drill Down Combo PRO (Filter) visual to analyze the median total compensation for each organizational department broken down by gender. Each department can be drilled into to extract insights about the business unit and further drilled into each job title. I also included the average tenure in years of the employees within each category to better understand the compensation structure of the organization.
This report section contained another Drill Down Combo PRO (Filter) visual to provide insights on the median total compensation by ethnicity and gender. These two visuals when used in tandem and leveraging cross-filtering can provide a nearly complete picture of the compensation structure between departments and equity across demographic groups.
When the two Median Total Compensation visuals are used along with the demographic and geographic distributions visuals a full understanding and in-depth insights can be extracted. The user can interact and cross-filter all of these visuals to tailor the insights to meet their specific needs.
The second component of the compensation structure analysis was to provide an analysis of departmental bonuses and historical bonus trends.
To provide detailed insights into the bonus trends I utilized a set of box and whisker plots to display granular details and card visuals to provide high-level aggregations. I will note that box and whisker plots may not be suitable in every scenario. However, for an audience that is familiar and comfortable interpreting these plots they are a great tool and were well suited for this analysis.
Workforce Retention & Turnover
The second page of the report focused on the analysis of employee retention and turnover. For this report the retention rate was calculated as the percentage of employees that remained with the organization during a specific evaluation period (e.g. annually) and the turnover rate is the rate at which employees left the organization expressed as a percentage of the total number of employees.
For this analysis, I thought it was key to provide the user and quick and easy way to flip between these metrics depending on their specific requirement. I did this by implementing a button experience at the top of the report, so the user can easily find and reference what metric they are viewing.
Another key aspect to enhance the clarity of the report is the visuals remain the same regardless of the metric being viewed. This eases the transition between the different views of the data.
Across the top of the report page is a set of Drill Down Combo Bar PRO (Filter) visuals to analyze the selected metric by department and business unit on the left and age, gender, and ethnicity in the right-side grouping.
Each of these visuals also use the threshold visual property to display the average across all categories. This provides a clear visual indicator of how a specific category is performing compared to the overall average (e.g. retention for the R&D Business Unit is slightly worse (87%) than the organizational average of 92%).
All of these visuals can be used to cross-filter each other to get highly detailed and granular insights when required.
In addition to examining the retention and turnover rate among organizational and demographic groups there was an objective to provide insight to the temporal trends of these metrics. The Drill Down Timeline PRO (Filter) visual was perfect for this.
This visual provides a long-term view of the retention and turnover rate trend while providing the user an intuitive and interactive way to zoom into specific time periods of interest.
Additional Features
Outside to of the main objectives of the report outlined by the 10 specified questions there were additional insights, features, and functionalities built into the report to enhance usability and the user experience.
On the Demographic & Compensation Analysis page this included a summary statistics button to display a high-level overlay of demographic and salary summaries.
On both pages of the report there was also a clear slicer button to clear all selected slicer values. However, this clear slicer button did not reset the report to an initial state or reset data filters due to user interactions with the visuals. See the Feedback and Improvements section for details and the implemented fix.
Lastly, each page had a guided tutorial experience to inform new users about the report page and all the different features and functionalities the report and the visuals offered.
There are various other nuanced and detailed features of this reports and too much to all cover here. But please check out and interact with the report here:
The report was built with the HR Analysis dataset and includes ZoomCharts custom Drill Down PRO visuals for Power BI.
Feedback and Improvements
My submitted report was discussed in the Learn from the Best HR Reports: ZoomCharts TOP Pick webinar which provided excellent feedback on areas to improve the report.
You can view the webinar discussion below.
The first improvement was to address the sizing of the map. Initially, when the report loads the map visual is too small to view all of the data it provides.
To address and correct this the Employee Count by country visual was removed. This visual provided helpful summary information and an effective way to filter the map by country, however, the benefits of displaying all the data on the map outweigh the benefits of this visual.
Also mentioned in the discussion of the map is the limitation in colors. Initially the ethnicity groups Black and Asian used the same colors used to visualized gender and a source of potential confusion.
To address this, I extended the color palette to include two additional colors to better distinguish these groups. These groupings are also visible on the Workforce Retention & Turnover page. These visuals were also updated to ensure consistency across the report.
The next area of feedback was around the clear slicer button. As shown in the webinar it only clears the selected slicer values and uses Power BI’s built-in Clear all slicers button.
The functionality of the clear filter button on both pages was updated to reset the report context to a base state with no filters applied to the page. The size of the button was also increased to make it easier to identify for the user.
Another point of feedback was regarding the navigation icon tooltips. I did not make an adjustment to the report to address this. As shown in the webinar if you hover over the active page icon there is not a visible tool tip. I left the report this way because the current page icon indicator on the navigational element and the report page has a title providing this information to the user.
However, on each page if you hover over an icon to a different page, there should be a tool tip that displays and addresses the main objective of this feedback. This functionality is correct on the Demographic & Compensation Analysis page but required correcting on the Workforce Retention & Turnover page to be consistent.
Lastly, there was feedback on the use of the Box and Whisker plot within the report. I agree the use of this visual is heavily dependent on the end user’s comfortability with interpreting these visuals and is not suitable in all cases. However, for this report I think they provide a helpful visualization of the bonus data and remained in the report.
Wrapping Up
Getting started with participating in these type of data challenges can be an intimidating task. With Power BI and report development there is always more to learn and areas to improve so there is not some static skill level or point to begin with these challenges. The best method to move forward is to just start and show yourself patience as you learn more and grow your skills.
For me, the main take aways from participating in this challenge and why I plan to participate in more moving forward are:
When learning a new skill repetition and continued use is essential, and with report development the more reports you create the better and more experienced you will be. This challenge provided an excellent opportunity to use a unique dataset to create a report from scratch.
Others are using the same data and creating the own report to share. Viewing these different reports to see how others solved the same data challenge can be extremely helpful in growing your skills and expanding the way you approached the challenge.
Participating in the ZoomCharts Challenge provided tailored feedback on the report submission. Providing helpful insight on how others viewed my report and highlighting areas for improvement.
Access to custom visuals. Through this challenge I was able to learn and work with ZoomCharts custom visuals. I really enjoyed learning these and adding that experience to my skillset. Find out more about these extremely useful visuals here.
Thank you for reading! Stay curious, and until next time, happy learning.
And, remember, as Albert Einstein once said, “Anyone who has never made a mistake has never tried anything new.” So, don’t be afraid of making mistakes, practice makes perfect. Continuously experiment, explore, and challenge yourself with real-world scenarios.
If this sparked your curiosity, keep that spark alive and check back frequently. Better yet, be sure not to miss a post by subscribing! With each new post comes an opportunity to learn something new.