


Ask Copilot in Power BI Desktop for a year-over-year growth measure, and you get a clean measure along with a note that it needs a properly configured date table. Whether your model has one, and which other measures depend on it, is left to you. In Power BI Desktop, Copilot works one request at a time, beside the model.
Power BI AI development has a middle step between that and a fully agentic workflow. An assistant that works across the whole semantic model through tools, while you review and approve each change. If you missed the start of this Power BI’s AI Toolkit series, Evaluating Copilot for DAX Development in Power BI Desktop covers where Copilot fits.

Power BI AI Toolkit: Evaluating Copilot for DAX Development in Power BI Desktop
If you have ever felt that slight surge of hope when clicking the Copilot button in Power BI Desktop, you are not alone.
Quick Start: The Loop in Six Steps
Claude, running in the Claude Desktop app, connects to your semantic model via Microsoft’s Power BI MCP server, which provides it with tools to read the model, run DAX queries, and make changes. You approve each tool call before it runs, unless you’ve set that tool to Always allow.
On a PBIP project, Claude uses two connections in the same chat session. The PBIP folder connection is where it reads and makes changes, but it holds only the model’s metadata, so DAX queries use a live model connection. For a local project, that’s the project open in Power BI Desktop.
Here’s the working loop:
- Connect to the model in your PBIP folder and to the same project open in Power BI Desktop.
- Inspect the model before changing anything. Ask Claude to summarize it and flag what needs attention.
- Propose changes. Ask for a plan that names every object Claude will change, and keep each request small and verifiable.
- Approve each tool call in Claude Desktop. Claude provides different options. For example, you can Always allow reads and Allow once for writes.
- Apply the exported changes with Apply external changes in Power BI Desktop.
- Verify with a DAX query through the Power BI Desktop connection, then check the affected visuals.
How AI-Assisted Power BI Development Works with Claude
In this AI-Assisted approach, Claude proposes and applies changes to the Power BI semantic model using tooling provided by the Power BI MCP server. Four components do the work:
- Claude Desktop: the app where you interact with Claude and request changes. Claude decides which tools a request needs.
- The MCP server: Microsoft’s Power BI MCP server, which Claude uses to discover and call tools for authoring and querying in the semantic model.
- The semantic model: Claude’s copy of the definition from your PBIP folder that it updates and exports back to the PBIP folder, and a live connection to the model open in Power BI Desktop that Claude queries.
- You: approving each tool call before it runs, then applying the changes in Power BI Desktop.
The MCP server is Microsoft’s Power BI Authoring MCP server.
It comes in two deployments. As of writing this post, the local server is generally available, and the hosted server is in preview. Only the local server can reach Power BI Desktop and PBIP files on your machine.
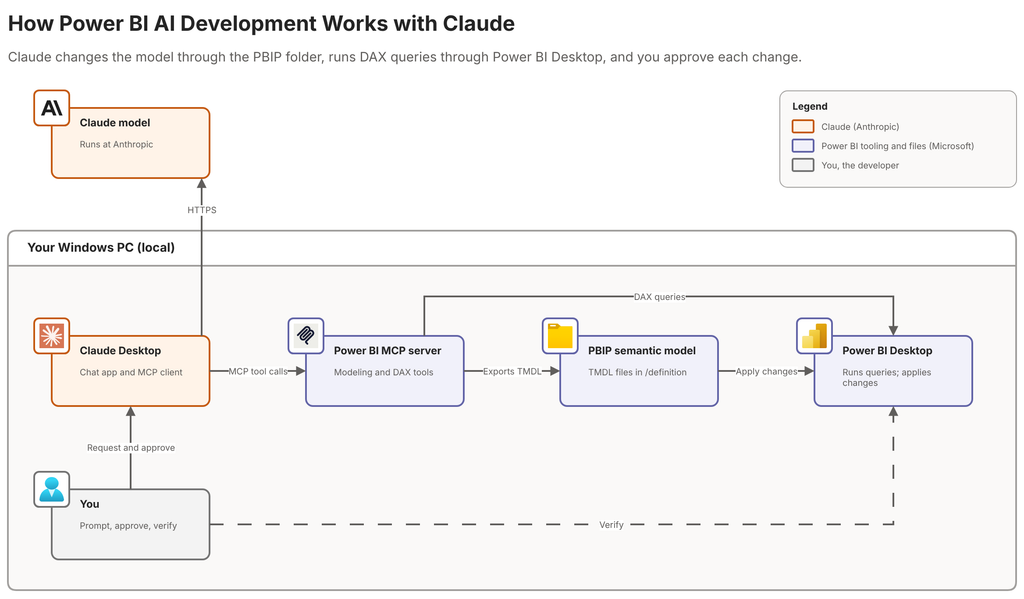
Setting Up Claude Desktop
Claude Desktop uses the manual configuration from Microsoft’s Power BI Authoring MCP Server repository, wrapped in Claude Desktop’s mcpServers key.
In Claude Desktop, open Settings > Developer > Edit Config to open claude_desktop_config.json, then add the server details:
{
  "mcpServers": {
    "powerbi-modeling-mcp": {
      "type": "stdio",
      "command": "npx",
      "args": [
        "-y",
        "@microsoft/powerbi-modeling-mcp@latest",
        "--start",
        "--accepteula"
      ]
    }
  }
}
Save the file, then:
- Fully quit Claude Desktop (closing just the window isn’t enough), then reopen it.
- Select
+> Connectors in a new chat and confirm the server and its tools are listed. - In Power BI Desktop, select File > Options and settings > Options > Preview features, turn on Detect and reload external PBIP changes, and restart Power BI Desktop. Without it, Power BI Desktop won’t pick up Claude’s changes.
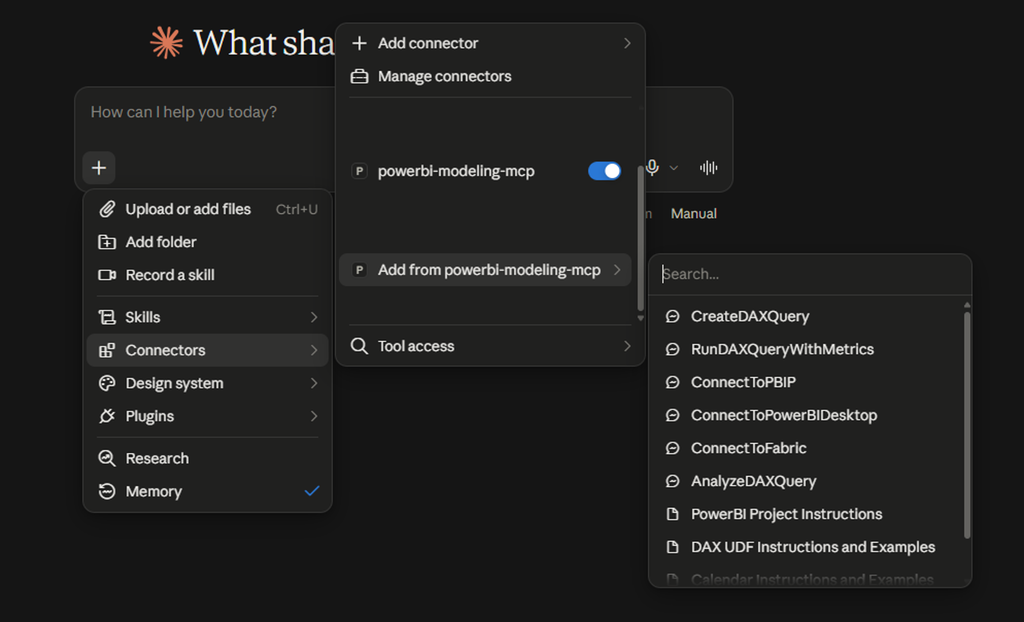
Before you can use the MCP server tools, you must review and accept its end-user license agreement. Review the EULA. Every tool call is blocked until it’s accepted.
On the first use, tell Claude you accept the terms and approve the accept_eula call. The server saves your acceptance locally, so you only have to do this once. Once you’ve reviewed the EULA, you can add --accepteula to the args (like shown above), which is meant for unattended use of the MCP server tools.
When you’re first exploring the tools, add "--readonly" to args as well: it blocks every write to your semantic model until you remove it.
Using VS Code with GitHub Copilot instead? Microsoft’s VS Code extension is available and installs the same MCP server. Although, initial setup is different, the working loop and prompts in the rest of this post apply the same way. Claude Code, whether in a terminal or VS Code, works differently: it can edit project files while running multi-step work on its own. That’s the agentic tier of Power BI’s AI toolkit and is covered in the next post.
The Working Loop
Every change follows the same six steps: connect, inspect, propose, approve, apply, and verify.
Inspecting first ensures Claude’s plan is based on the model as it is, not as Claude assumes it is. Approving each call puts you between the plan and the model. Verifying means you rely on a query’s results, not Claude’s summary of the update.
Throughout, watch the tool calls. Each response in Claude Desktop starts with a collapsible list of the server’s tools it used, such as Connection operations, Measure operations, and DAX query operations.
Expand one, and you’ll see the operation, the connection it ran against, and the result. That list is your record of what Claude read and what it changed.
Connect
Connections can remain open across chat sessions. To avoid confusion about which model or connection is being used, close all connections to a model when you’re done working with it. At the start of a new chat, you can check for open Power BI connections by asking Claude.
List all Power BI connections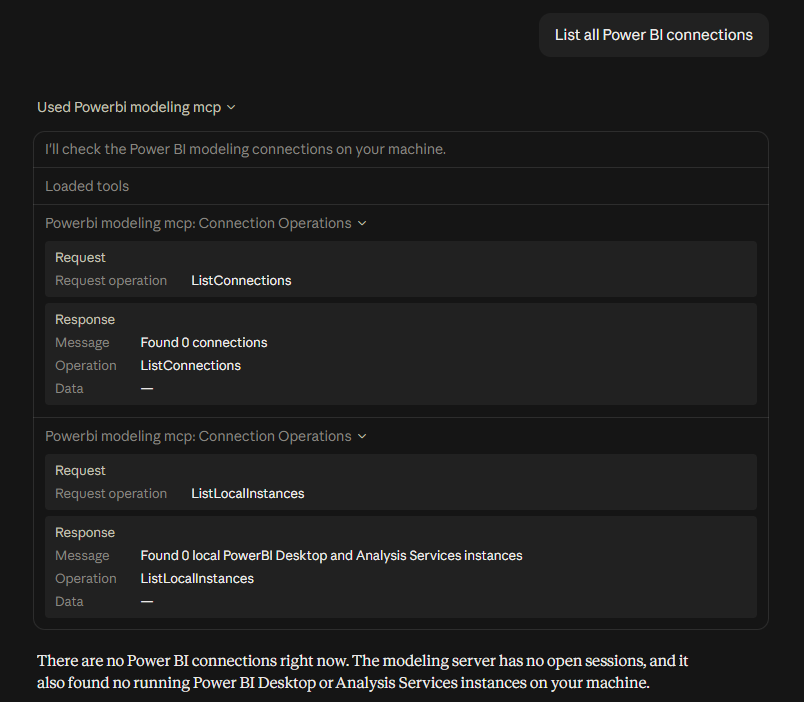
If any leftover connections are not needed, ask Claude to close them before you start.
Then open the two connections, starting with the PBIP folder.
Open semantic model from PBIP folder 'C:\Projects\<your-project-path>'.This connection loads the model’s definition from the project directory, and Claude reads and exports changes to it. The response reports what it loaded, along with a warning worth reading: Changes made through MCP are not automatically written to the disk. Run ExportToTmdlFolder before disconnecting to persist them.
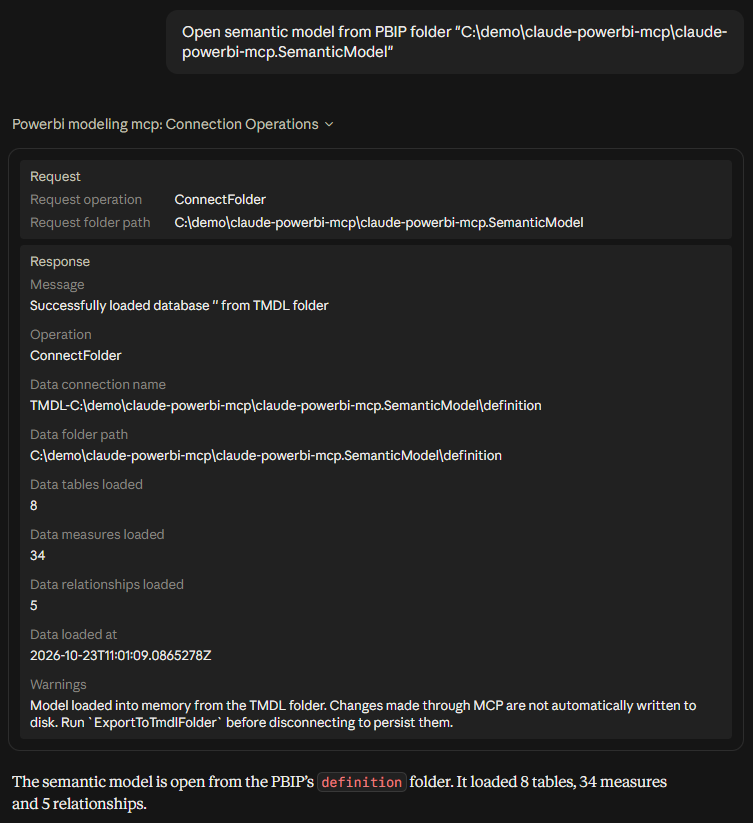
The definition holds no data, so DAX queries need the live model open in Power BI Desktop.
Connect to <your-project-report> in Power BI Desktop for DAX queries only.Claude finds the running Desktop instance and connects to it.
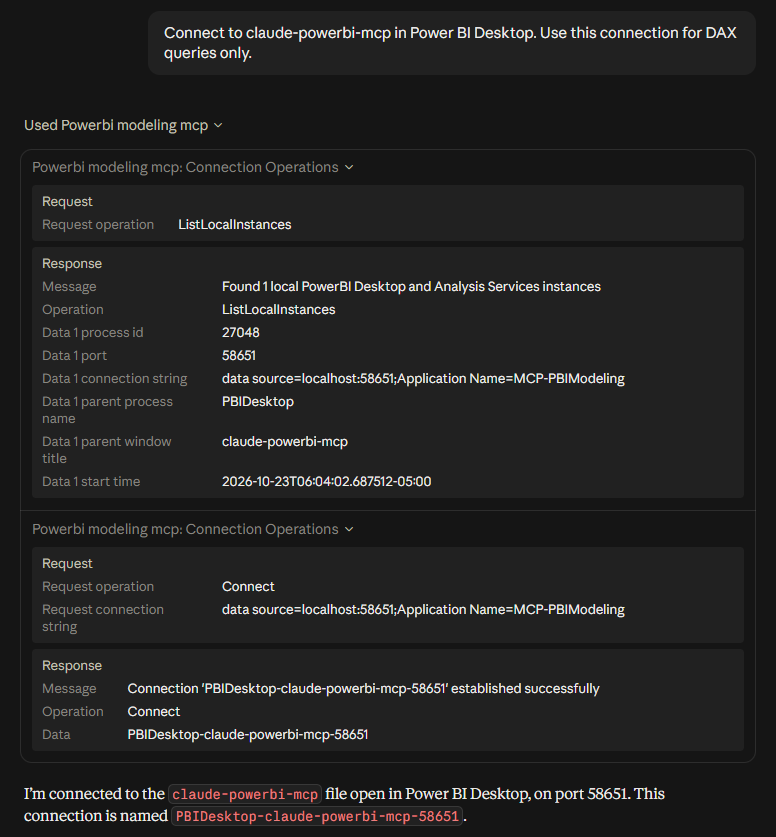
Each connection has its own name, and every tool call shows which one it used.
| CONNECTION | SOURCE | USE |
|---|---|---|
| PBIDesktop- | Power BI Desktop (live model) | DAX queries to verify measure results |
| TMDL- | PBIP TMDL folder (offline copy) | Model reads and edits, exported back to the PBIP folder when you want to save them |
The two copies don’t see each other’s edits. Queries through the live connection reflect the model as it is in Power BI Desktop, so they won’t see Claude’s changes until those are exported and applied.
Inspect
Before asking for any changes, ask Claude to inspect the model.
Inspect the model and provide a summary of tables, relationships, and measures.
Then flag any issues you identify.
This step is easy to skip, but it’s how you ensure Claude understands the model as it is. The tool calls show that Claude used both connections: the TMDL- connection to list the model’s tables, and the PBIDesktop- connection to run a series of DAX queries against the data.
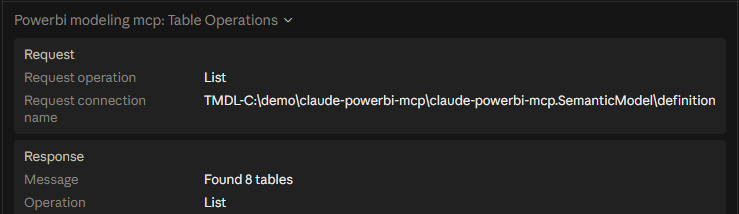
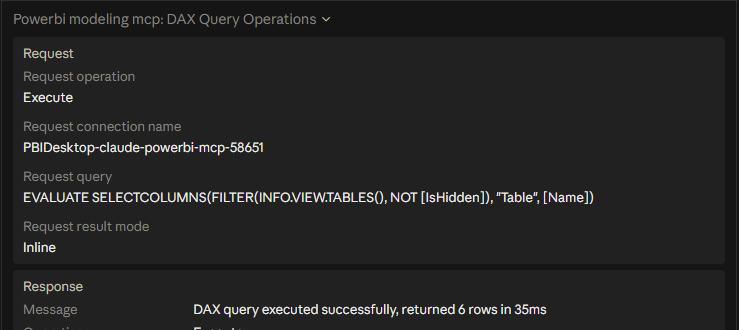
The DAX queries provide valuable information for the inspection, and they show up in the results. The summary includes details the definition alone can’t provide: 746 sales rows running from January 2022 to September 2026, with every sales row matching a row in each dimension.
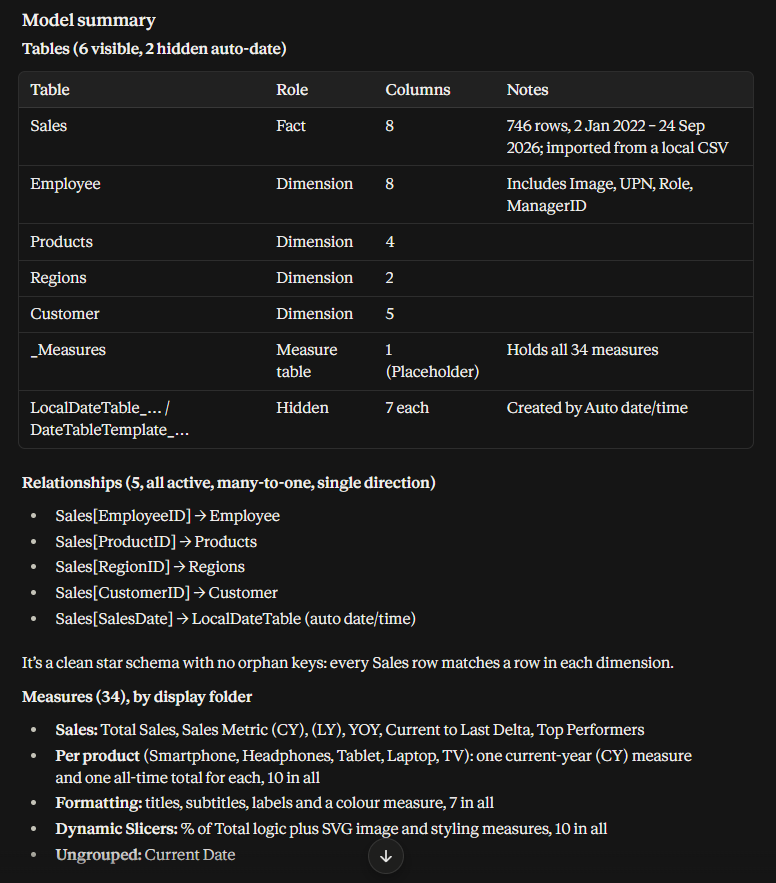
After the summary, Claude raised and ranked 17 issues from critical to minor. The critical issue is a missing DateTable, which Claude identified as the root cause of 23 broken measures.
Claude didn’t just infer that from the definition. It evaluated the Sales Metric (CY) against the model in Power BI Desktop, which returned Cannot find table DateTable.
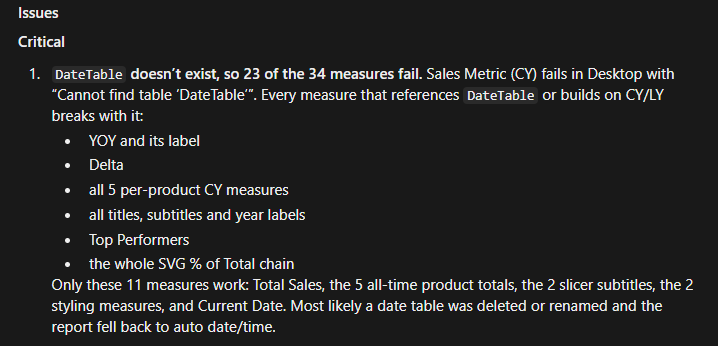
Claude then identified various other issues, including high-priority items such as a hardcoded date, medium-priority items to address inconsistent formatting and measure logic, and low-priority items including unused measures and a local CSV source, which would require a gateway to refresh if published to the Power BI Service.
Treat the inspection report as findings to check, not a verdict. Every item names the measure or setting involved, so each one is quick to confirm.
Propose
Ask for a plan before any change, and keep each request small enough to easily review. A good request does four things:
- Names the objects to change
- Says what shouldn’t change
- Says which connection to write through
- Asks Claude to verify its own work
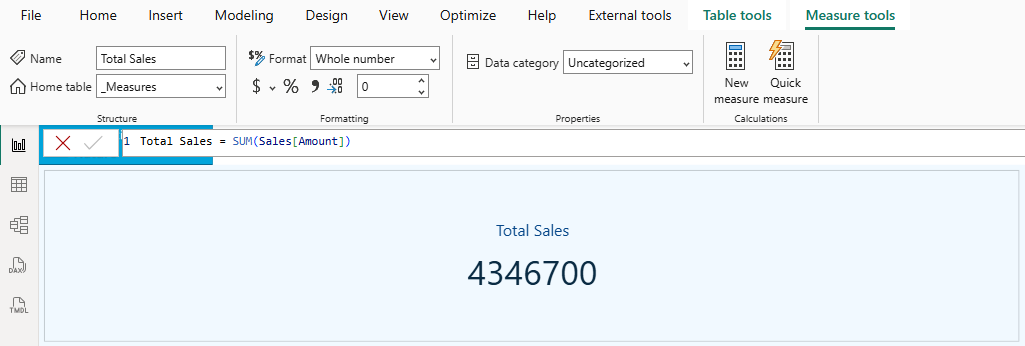
The inspection flagged that Total Sales uses the format string 0, with no currency symbol or thousands separator.
Plan a fix for the Total Sales format string. It currently uses 0, with no currency symbol or thousands separator.

List every object you'll change, with its current and new value.
Don't change anything else, and don't make changes until I approve the plan.
Make the change through the PBIP folder connection only, then export it to the TMDL files.
Claude’s plan proposed one change to the one object: _Measures[Total Sales], from 0 to \#,0.00;(\$#,0.00);\$#,0.00. It explained the choice: the measures built on Total Sales already use that format, so the base measure would display the same way they do. It also offered a whole-dollar alternative.
The plan was just as clear about what wouldn’t change. The expression, the display folder, and every other property of the measure. It would keep the static format string rather than switch to a dynamic one, and it wouldn’t add the formatting annotation. Claude also named the TMDL- connection it would write through.
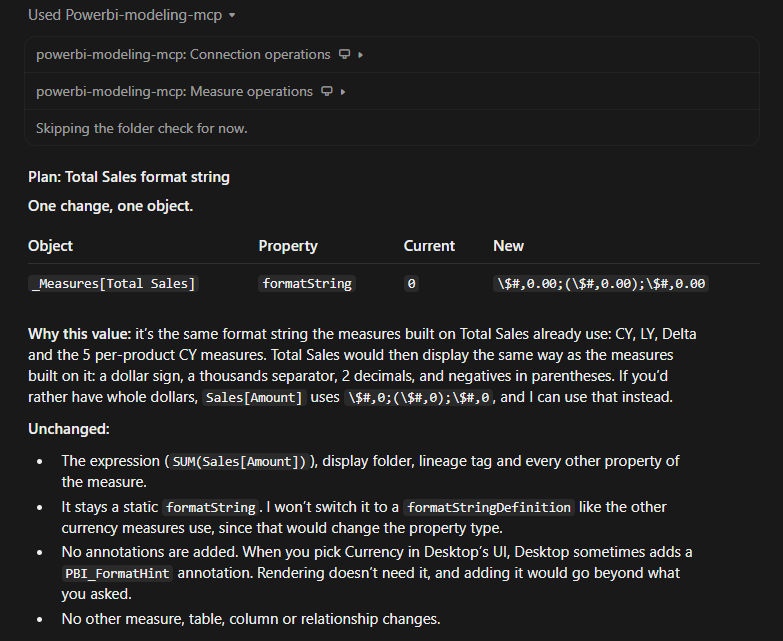
Read the plan before you approve it, and check that it changes only what you asked for. Check Claude’s reasoning too. For example, in this report we would want to confirm that the measures built on Total Sales really use that suggested format before accepting it as a valid reason.
In the plan response, Claude also warned that exporting writes out the whole model, not just _Measures.tmdl. If the serializer formats anything differently from how Power BI Desktop wrote it, other files can change on disk even though the model itself doesn’t.

Approve
When the plan looks right, tell Claude you approve and to implement the plan.
Approving the plan doesn’t skip the approval prompts. Every tool call that changes the model still stops in Claude Desktop first, showing the tool, the operation, and the value it will write, with three choices:
- Allow once runs this call only. Use it for every change while you get familiar with Claude and Power BI.
- Always allow runs this tool from now on without asking, in this chat session and future ones.
- Decline blocks the call. Tell Claude why, and ask it to revise the plan.
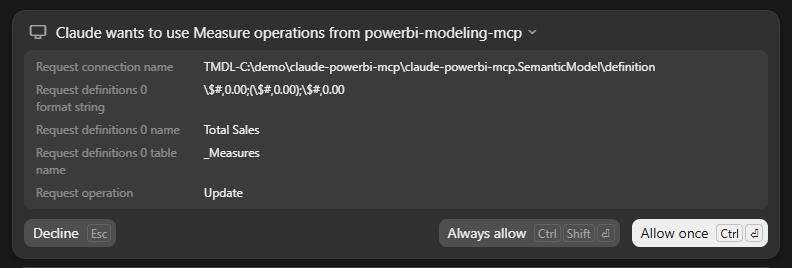
Compare each approval with the plan you approved. The operation, the measure, the new value, and the connection should all match. If anything differs, decline. The approval prompt is the last point where you can stop the change before it reaches the model.
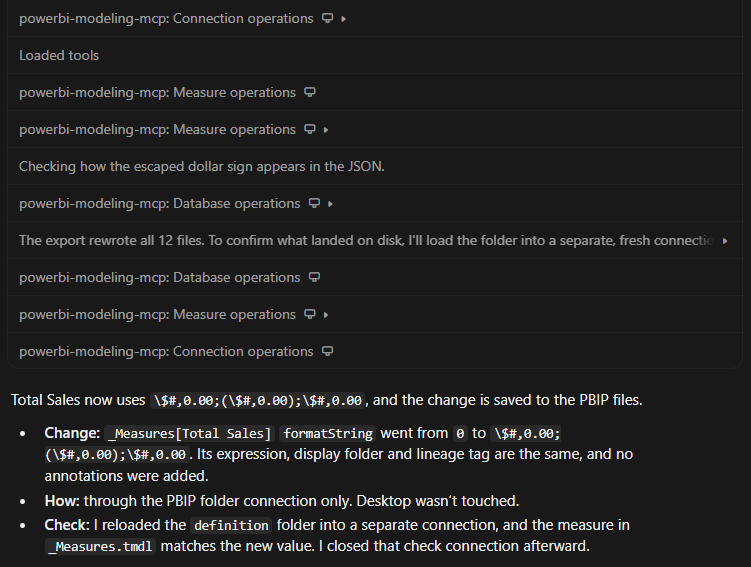
The export is a separate Database Operations call, so it asks for its own approval. That gives you a second checkpoint: the change is in Claude’s copy, but nothing is on disk until you allow the export.
When Claude is done, it reports what it changed and how it checked. Here, it confirmed that Total Sales now uses \$#,0.00;(\$#,0.00);\$#,0.00 and that the expression, display folder, and lineage tag were unchanged. It also reloaded the definition folder through a new connection to confirm the new value was on disk, then closed that connection.
Set permission ahead of time. In Settings > Connectors > powerbi-modeling-mcp, Claude Desktop sorts the server’s tools into read-only and write/delete groups. Setting the read-only group to always allow lets Claude connect and query without stopping, while every change and export still asks. One catch: the server groups tools by object type, so Measure Operations sits in write/delete even though it also lists measures. Claude will still ask when it reads them.
Apply
When Claude exports, Power BI Desktop notices the changed files and shows a banner that states This project’s files were changed externally. Apply to view the latest changes. Select Apply external changes.

If you have unsaved edits in Power BI Desktop, a warning states that applying will overwrite them. That’s why it’s best not to edit in Power BI Desktop while Claude is working.
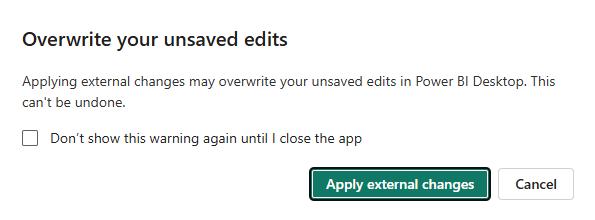
The overwrite works in both directions. Claude’s export writes its whole copy of the model, so anything you change and save in Desktop after Claude connected would be replaced by its next export. If you do make changes in Power BI Desktop mid-session, ask Claude to reopen the PBIP folder before its next change.
Verify
Once the change is applied, ask Claude to verify the update through the live connection.
I've applied the changes in Power BI Desktop. Verify the Total Sales format string with a DAX query through the Desktop connection.Each query is a DAX Query Operation call, so the approval prompt shows the connection and the full query before it runs. Confirm it’s the PBIDesktop- connection.
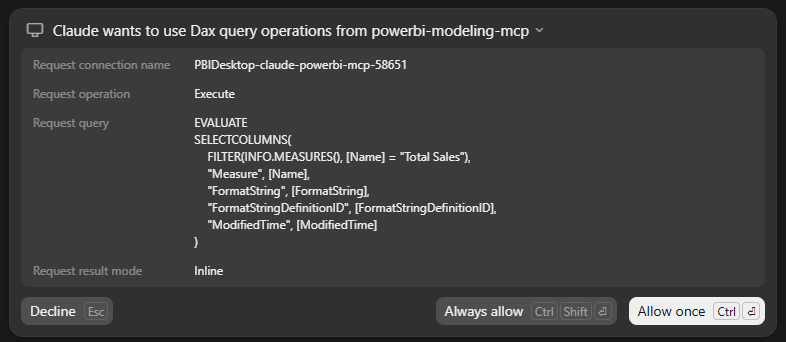
Read the queries, not just the answer. Claude’s first query used INFO.VIEW.MEASURES() and returned a null format string for Total Sales, and Claude treated that as ambiguous rather than reporting it as the result.
Claude then checked again with INFO.MEASURES(), which returned the new value. That query also confirmed the format string is still static, as the plan said, and that the measure’s modified time came after the export.
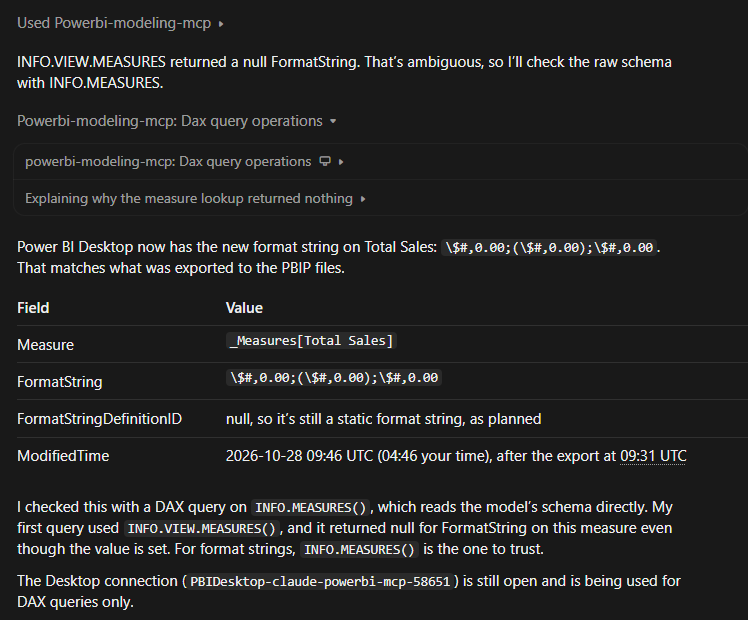
A query can look like success and still prove nothing: the wrong connection, the wrong function, or a plausible number from the wrong filter context. The tool calls show exactly what ran, so check them.
Then check the report. The MCP server works on the semantic model and can’t see report pages, so a change that queries correctly can still look wrong or break in a visual. Select the measure and check its properties, then look at the visuals that use it.
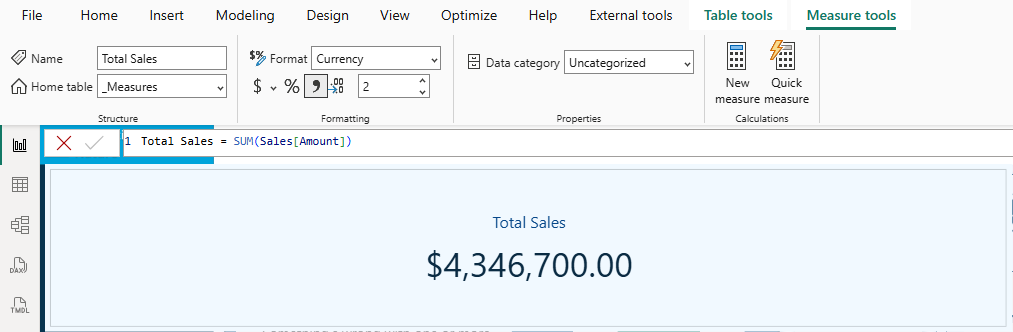
Total Sales now shows Currency with two decimal places in the Measure tools ribbon, and the card displays $4,346,700.00. The change is verified in the model and in the report, which closes the loop.
Five Use Cases on a Broken Model
Each use case runs the same loop on one sample model: the sales model from earlier in the series, with its date table deleted. With the date table gone, the Sales Overview page opens with broken visuals. You can download the model from the Power BI AI Toolkit repo and follow along.
Claude’s responses vary from run to run, so yours won’t match the ones shown here exactly. The pattern should hold, so check the specifics against your own model.
Rebuild the Date Table
The inspection traced 23 broken measures to the missing date table and flagged it as critical. That makes it the first fix, because every other change depends on measures that evaluate.
Start by asking for a plan that rebuilds the table to match what the measures expect, without touching the measures themselves.
Plan how to restore the DateTable the existing measures expect. Include every column the measures reference, the relationship to Sales[SalesDate], and marking it as a date table.

List every object you'll create or modify, and show the table's DAX.
Don't change any existing measures, and don't make changes until I approve the plan.

Make changes through the PBIP folder connection only, then export them to the TMDL files.
Claude started from the existing measures rather than a generic date table template. Ten of the measures depend on DateTable, using three columns: Date, Year, and Year Category.
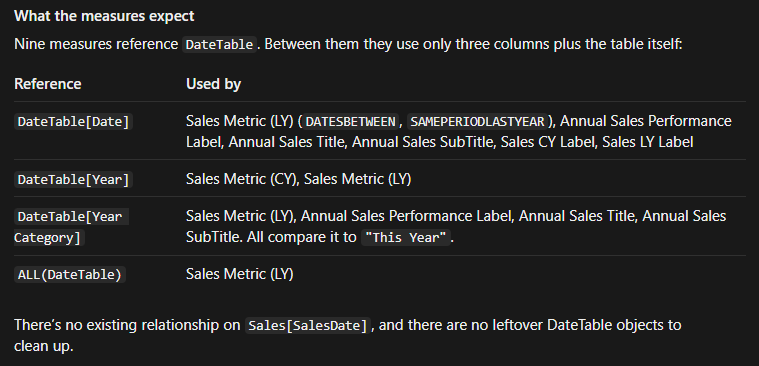
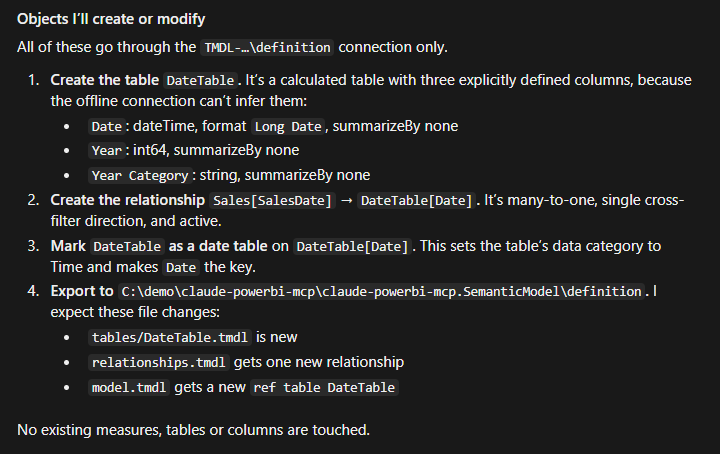
The plan listed three objects to create:
- The calculated date table, containing only the referenced columns.
- A single-direction many-to-one relationship from
Sales[SalesDate]toDateTable[Date]. - The date table marking, with
Dateas the key.
Rather than present every choice as settled, Claude asked to confirm four items:
- Full calendar years: the table runs from January 1 of the first sales year to December 31 of the last, because the date functions need a contiguous range.
Year Category: it’s driven by the model’sCurrent Datemeasure rather thanTODAY(), which keeps it in sync with theLYlogic.- Labels for other years: the measures only test for
This Year, so labeling every other year with its number was a guess. - “This year” vs “This Year”: one measure spells it “This year”, which still matches because DAX string comparison is case-insensitive.
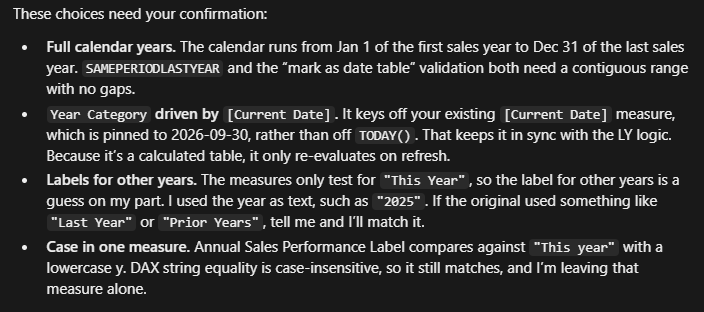
The labels are the ones Claude can’t make from the model, because they depend on how the report uses them. After reviewing the plan, approve it and answer Claude’s open questions.
Approved.

For Year Category, use "This Year" for the current year, "Last Year" for the year before, and the year number for the rest.
When finished, Claude reports what changed and where it departed from the plan.
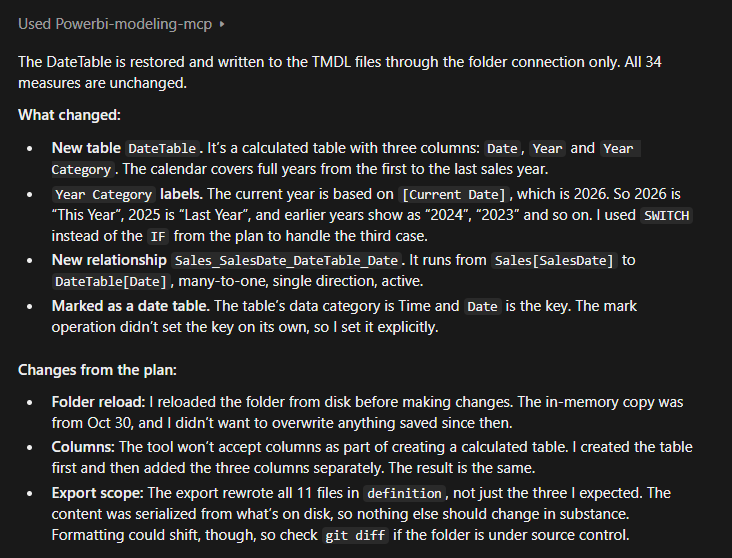
None of the departures from the plan change the outcome, but each is worth knowing, and the last one is why the plan’s file list matters. Under source control, the diff should show real changes only in DateTable.tmdl, relationships.tmdl, and model.tmdl.
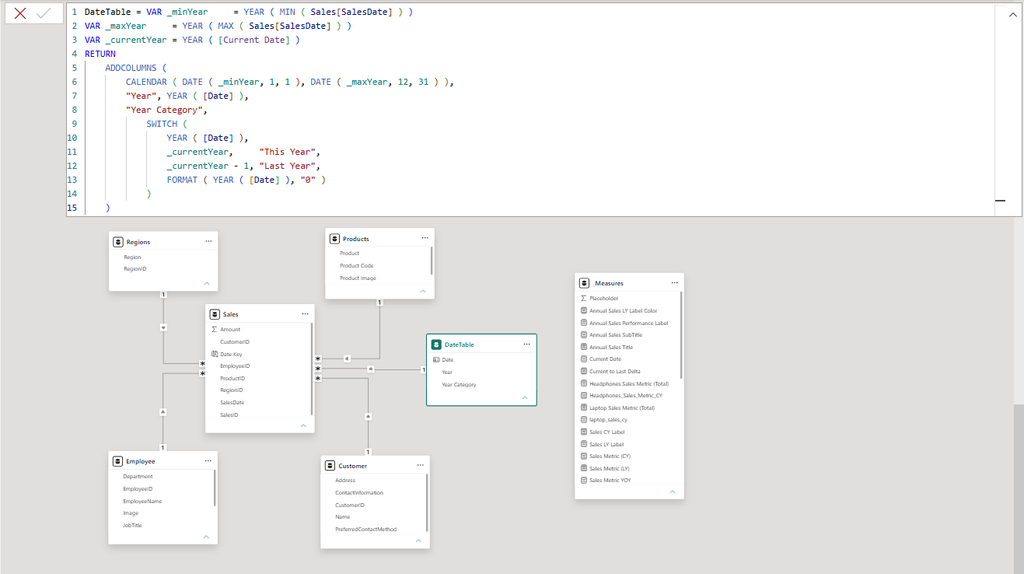
Here’s the table Claude created:
DateTable =
VAR _minYear     = YEAR(MIN(Sales[SalesDate]))
VAR _maxYear     = YEAR(MAX(Sales[SalesDate]))
VAR _currentYear = YEAR([Current Date])
RETURN
    ADDCOLUMNS (
        CALENDAR(DATE(_minYear, 1, 1), DATE(_maxYear, 12, 31)),
        "Year", YEAR([Date]),
        "Year Category",
            SWITCH(
                YEAR([Date]),
                _currentYear,     "This Year",
                _currentYear - 1, "Last Year",
                FORMAT(YEAR([Date]), "0")
            )
    )
After Claude exports the update, select Apply external changes in the banner. DateTable appears in the model, related to Sales.
Once it’s applied, ask Claude to verify the calculations through the live connection.
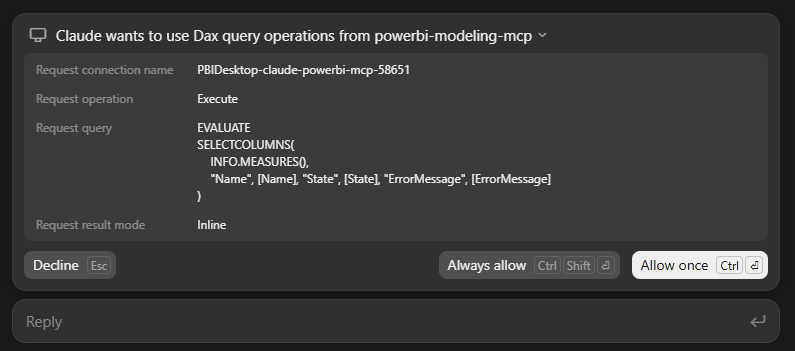
I've applied the changes in Power BI Desktop. Through the Desktop connection, verify the Sales Metric (CY) and Sales Metric (LY) measures return the values for each year, and check which of the broken measures now evaluation.Claude queries the measures themselves to verify the values. To check whether any measure is still broken, Claude reads each measure’s state and error message from INFO.MEASURES().
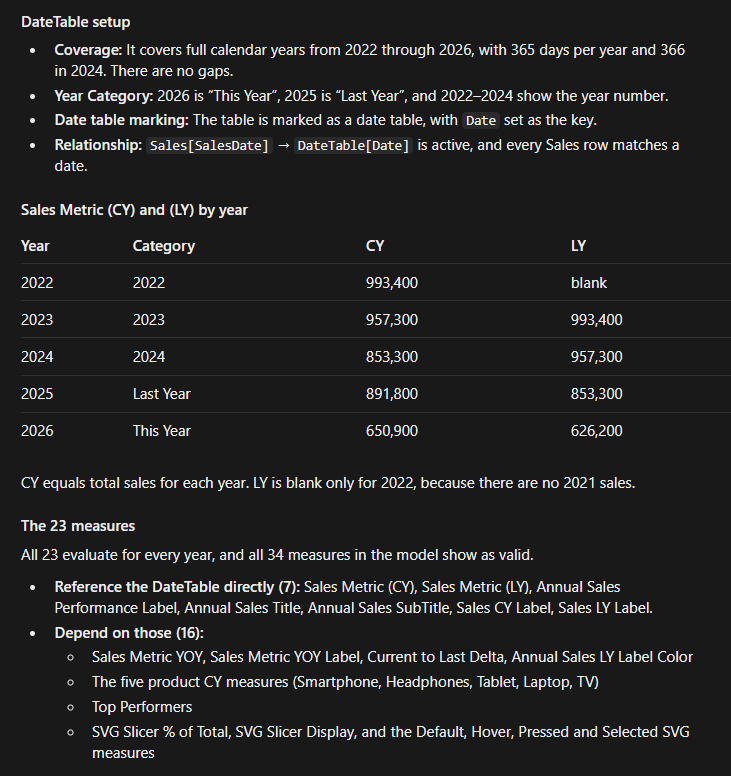
The results confirmed the table and the fix:
- The table: full years from 2022 through 2026 with no gaps, the right
Year Categorylabels, the date table marking, and an active relationship that every sales row matches. - CY and LY: values for every year, with LY blank only for 2022 because there are no 2021 sales.
- All 23 measures evaluate: the measures that reference
DateTabledirectly and the measures built on them.
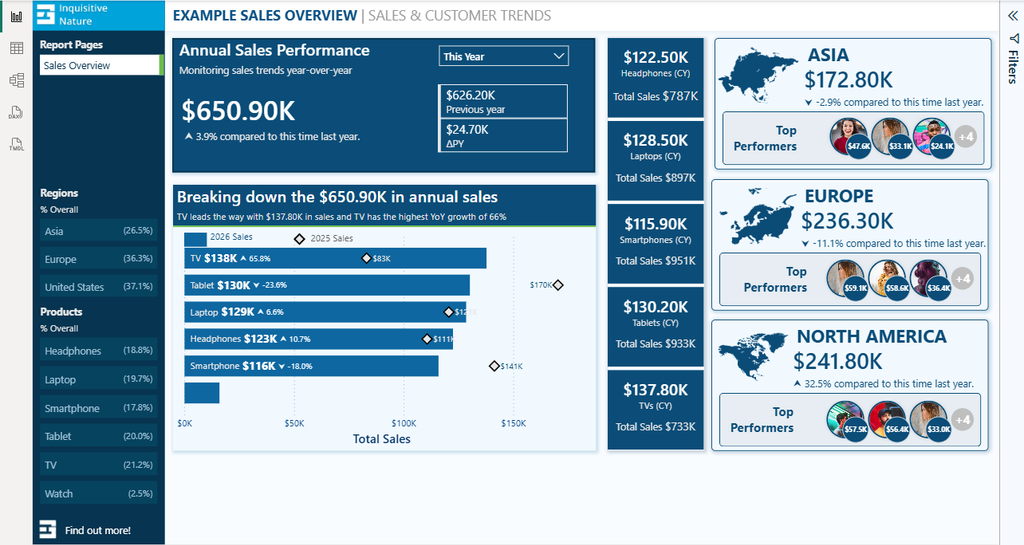
Last, check the report. The Sales Overview page recovers once DateTable is restored within the model. Every visual renders, and the headline numbers line up with expected values: $650.90K this year against $626.20K the previous year.
![Power BI Desktop Sales Overview page with all visuals rendering: annual sales of $650.90K up 3.9 percent, a breakdown by product, product cards and regional totals with Top Performers]](https://ethanguyant.com/wp-content/uploads/2026/11/18-case1-06-1024x639.png)
Understand a Model You Inherited
With every measure evaluated again, the next question for any inherited model is how its logic works, especially measures that are hard to read cold. Top Performers is one of those measures. It ranks sales by region and employee, keeps the top three, and builds an HTML string of profile photos and sales badges for an HTML Content visual.
Claude can read the DAX, but it can’t see the report. Attach a screenshot of the Top Performers cards to the prompt, and describe how the measure is used.
Explain the Top Performers measure: what it calculates, how it builds its output, and any issues with the logic.

In the report, it appears on one card per region, filtered to that region.
Test each issue with DAX queries through the Desktop connection, using the measure itself, and say whether it affects the measure in that context. Don't change anything.
Claude walked through the measure variable by variable, from the SUMMARIZE that groups sales to the CONCATENATEX that builds the HTML. Then it tested the card context directly.
Claude ran the measure for all three regions and all five Year Category values, 15 contexts in all. All 15 showed the correct three photos, badge values, order, and “+N” count.
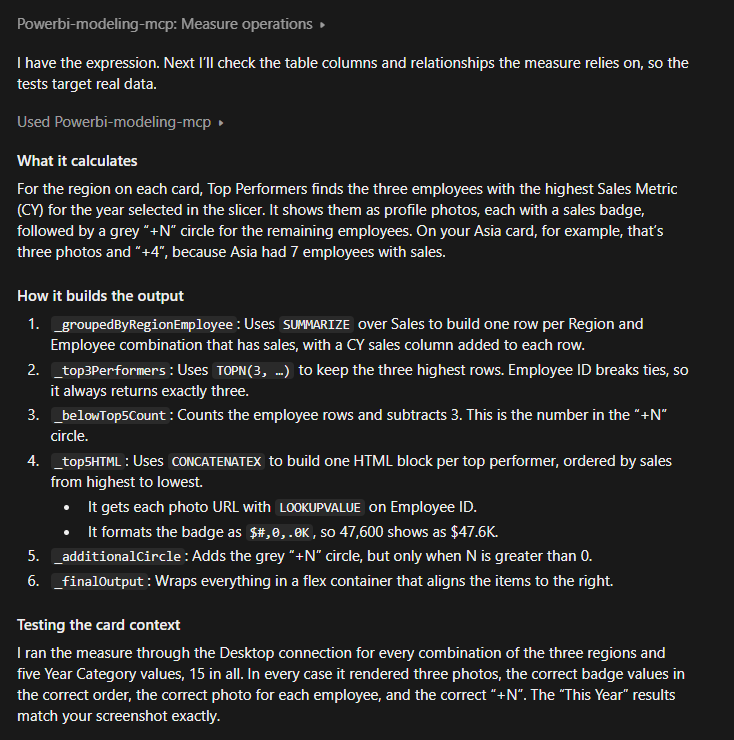
Claude also found seven issues and tested each one against the data. The most significant is in the grouping. The measure ranks region-employee pairs, not employees, and every employee sells in more than one region.
Without a region filter, the “top three” were three pairs, each worth $57.5K to $ 59.1K. The actual top three employees each sold more than $110K.
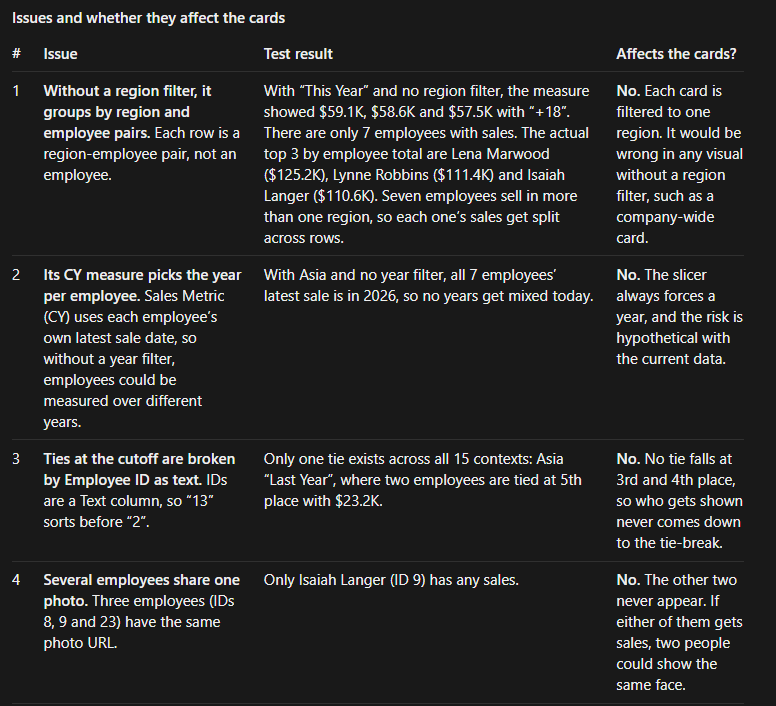
The rest were smaller: a tie-break on a text column, a shared photo URL, a SUMMARIZE pattern known to be risky, a badge too small for values over $1M, and leftover code that needs cleanup.
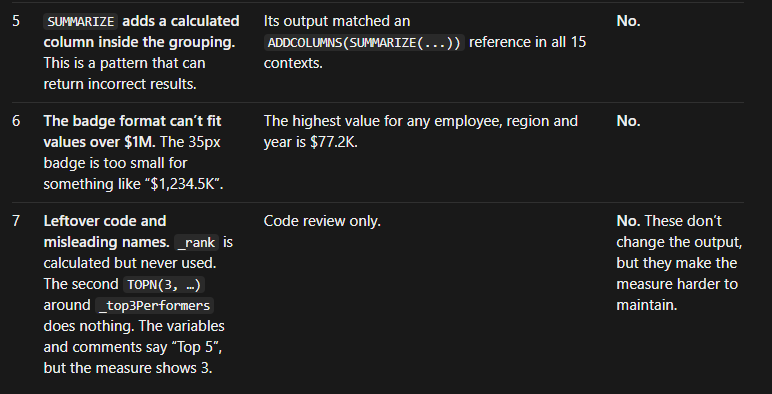
The verdict: the measure is correct on every card it appears on.

That’s the value of giving Claude the context. Without it, a list of seven issues reads like seven fixes. With it, you know one flaw matters, and only if someone reuses the measure without a region filter, such as on a company-wide card.
Whether to fix it now is your call. Either way, the next report author should know, and a measure description is the place to record the findings. The next use case covers that.
Document the Model in Bulk
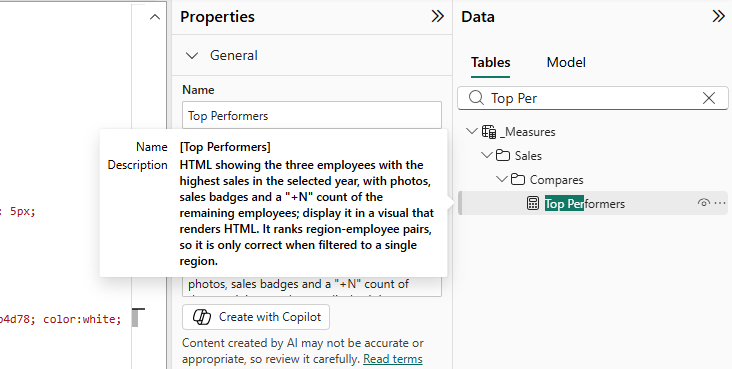
Measure descriptions are the documentation report authors actually see. They show as tooltips when you hover over a measure in the Data pane. None of the 34 measures had a description.
In Power BI Desktop, Copilot’s Create with Copilot writes them one measure at a time. Here, Claude can draft all of them in one pass, but each description is a claim about how a measure behaves, so each one needs to be checked.
Plan descriptions for every measure in _Measures. Each description should say what the measure returns and any filter behavior a report author needs to know, in one or two sentences of plain business language.

For Top Performers, note that it ranks region-employee pairs, so it's only correct when filtered to a single region.

Show the proposed descriptions as a table I can review. Don't change anything else, and don't make changes until I approve. Make changes through the PBIP folder connection only, then export them to the TMDL files.
Before writing anything, Claude tested the filter behavior it was about to describe against the live model. The all-time product totals ignore every filter in every context tested. The product CY measures override a product filter but keep year and region. Sales Metric (CY) falls back to the latest year when no year is selected.

Then Claude proposed a description for all 34 measures. Here is a sample:
| MEASURE | CLAUDE’S DESCRIPTION |
|---|---|
| Sales Metric (CY) | Sales for the selected year. If no year is selected, it returns the most recent year with sales, not all years combined; product, region, and other filters still apply. |
| Sales Metric (LY) | Sales for the year before the selected year; for “This Year” it covers last year from January 1 through the end of the Current Date month, so the comparison is like-for-like. It ignores date filters below the year level and is blank when there is no prior-year data. |
| Smartphone CY Sales | Smartphone sales for the selected year. Always shows Smartphone, even when the report is filtered to other products; year and region filters still apply. |
| Headphones Sales Metric (Total) | All-time Headphones sales across every year and region. Ignores all report filters and slicers. |
| Top Performers | HTML showing the three employees with the highest sales in the selected year, with photos, sales badges, and a “+N” count of the remaining employees; display it in a visual that renders HTML. It ranks region-employee pairs, so it is only correct when filtered to a single region. |
| Current Date | The fixed date (September 30, 2026) the model treats as today for the This Year comparison and the DateTable year labels. Change it to TODAY() for live data; the year labels only update when the model refreshes. |
Read the table of measure descriptions before approving, and spot-check the descriptions that make claims about filter behavior against the DAX. Those are the ones a report author will rely on, and the ones most likely to be wrong.
The plan also said how it would apply the change: one batch update to the description property, a read-back to confirm nothing else changed, then the export.
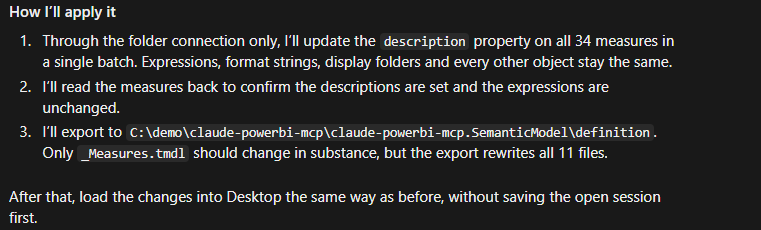
Approved. Update and export the descriptions.All 34 descriptions arrive in a single Measure Operations call, so there’s one approval prompt. With that much input, Claude Desktop shows it cut short. Select Show full input and review it before you allow it.
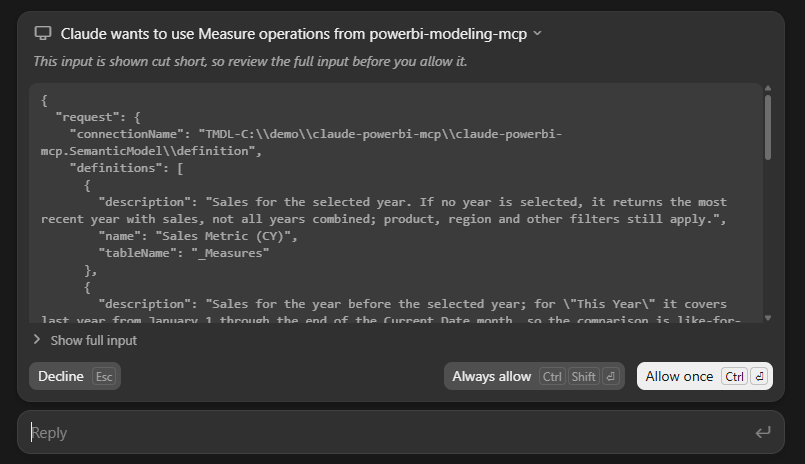
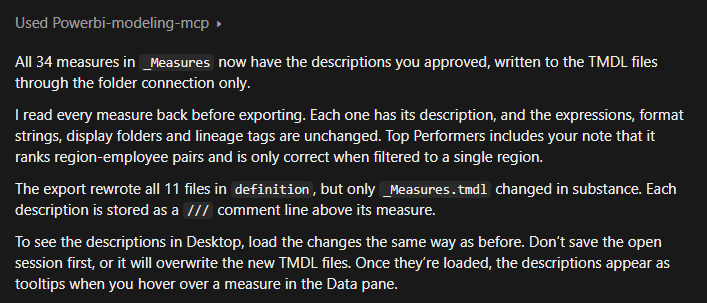
Claude read every measure back before exporting. The descriptions were set, and the expressions, format strings, display folders, and lineage tags were unchanged. Only _Measures.tmdl changed in substance.
In the file, each description is a TMDL description, written as a /// line above its measure declaration. If the project is under git version control, that’s what the diff will show.
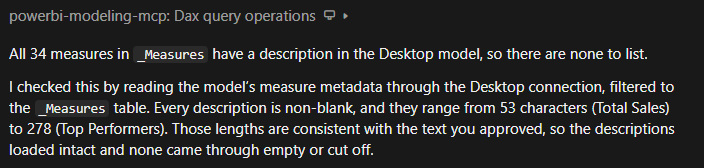
After applying the changes in Power BI Desktop, verify through the live connections:
I've applied the changes in Power BI Desktop. Through the Desktop connection, confirm every measure in _Measures has a description, and list any that don't.All 34 measures had a non-blank description.
The payoff is in the Data pane. Hover over Top Performers, and the caveat from the last use case is right where the next report author will see it.
Refactor at Scale
Five of the ten product measures don’t follow the naming pattern the others use: Smartphone CY Sales, Headphones_Sales_Metric_CY, laptop_sales_cy, tblt sales total, and TV Sales (Total). Renaming them is a straightforward ask of Claude. The risk is everything that refers to them by name.
Plan how to rename these five measures to match the naming pattern the other product measures use: Smartphone CY Sales, Headphones_Sales_Metric_CY, laptop_sales_cy, tblt sales total, TV Sales (Total).
Find every measure that references them, and include those reference updates in the plan.

Show a change log with each old name, new name and dependent object. Don't change anything else, and don't make changes until I approve.
Make changes through the PBIP folder connection only, then export them to the TMDL files.
Claude checked the model’s dependency metadata through the live connection, looking for elements that reference the measures, such as measures, calculated columns, calculated tables, or security roles. The change log maps each measure to the <Product> Sales Metric (CY) or (Total) pattern the other measures follow.
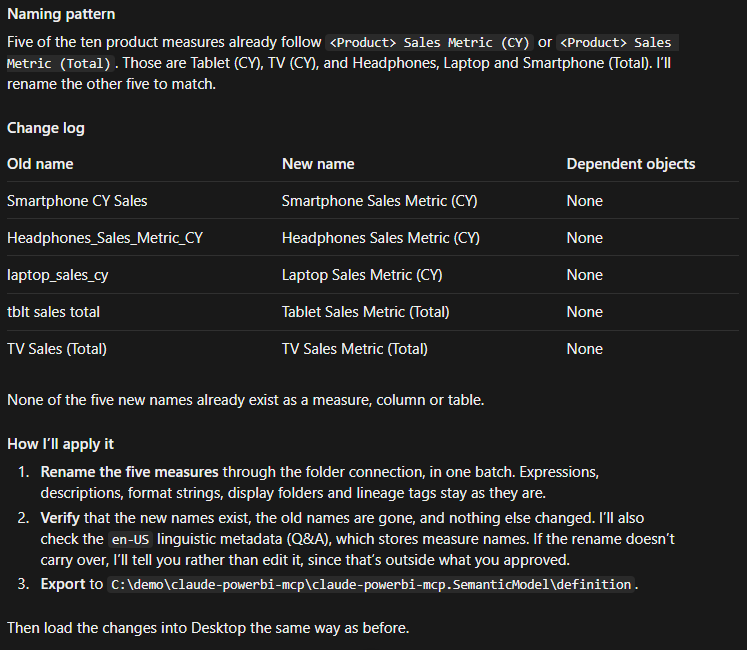
Without additional prompting, Claude flagged what the dependency check didn’t cover. Report visuals reference measures by name in the report’s JSON files, and a rename in the model files doesn’t update them, so any visual using these measures would break.
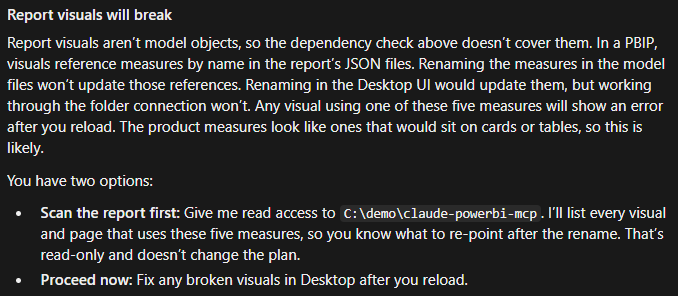
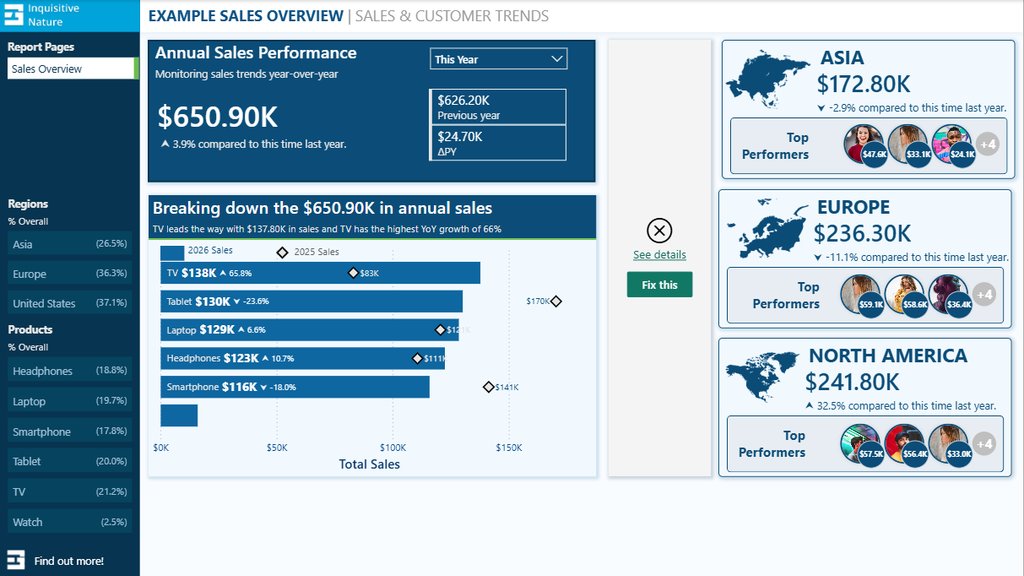
After approving the plan, Claude renamed all five measures in a single batch, read them back to confirm nothing else changed, and exported the update. In Power BI Desktop, after selecting Apply external changes, the product summary card on the Sales Overview stopped rendering correctly.
This is exactly what Claude flagged in the plan.
The verify prompt asks for the affected visuals as well as the model checks.
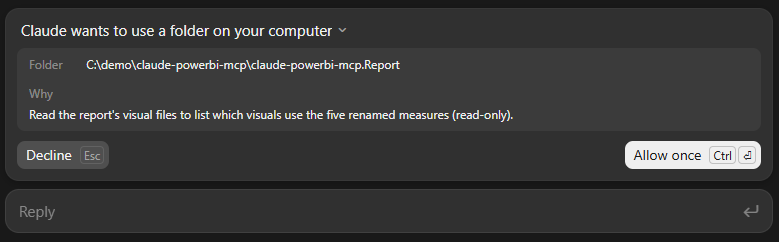
I've applied the changes in Power BI Desktop. Through the Desktop connection, confirm the five measures exist under their new names, the old names are gone, every measure that referenced them still evaluates, and provide a list of affected visuals.The model checks passed: the new name exists, the old ones are gone, and all 34 measures are valid. To find the visuals, Claude needed to read the report files, which the MCP server couldn’t reach.
Claude asked for read access to the report folder through Claude Desktop instead.
Exactly one visual used the old names. Three of its five data fields were broken. So were the reference labels, which the metadata check had missed.
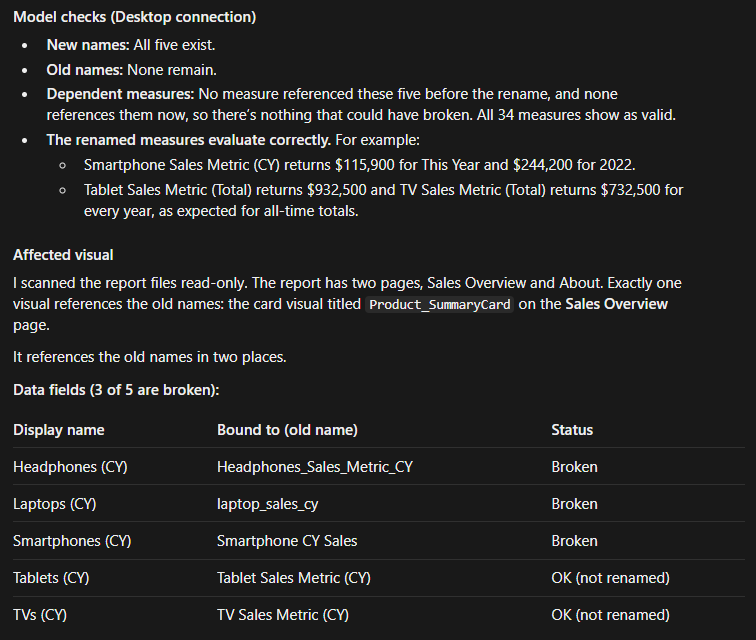
Claude laid out two fixes: re-add the fields in Power BI Desktop, or Claude can replace the old names in the visual’s visual.json. The second edits the report rather than the model, so Claude asks for your permission to do so. Ask Claude to run the updates.
Update the impacted visuals.Claude backed up the file, replaced 20 references (5 field bindings, 3 query references, and 12 formatting selectors), then compared the result with the backup. Only those 20 lines differed, the file was still valid JSON, and no old names remained anywhere in the report.
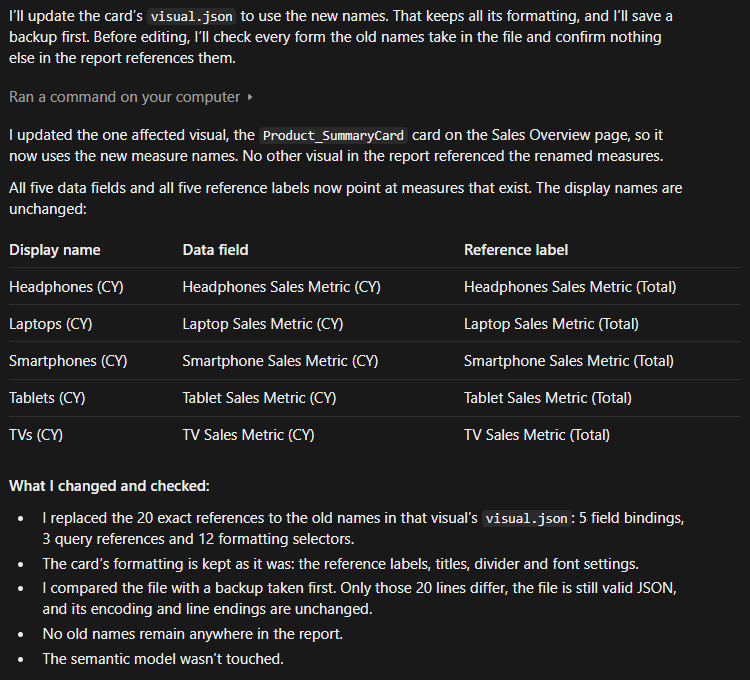
After applying the external changes, the card renders again, with all five products and their formatting intact.
The fix crossed a line worth noticing. The MCP server only changes the model, and the report edit used a separate folder permission. Editing report files is the next tier of tooling, and the next post in this series covers it in depth.
Plan a Report Page
The MCP server operates only on the semantic model. So it can’t be used directly to create or edit pages. Claude can still use it to handle the parts of page design that depend on the model, such as deciding what the page needs to show, writing the measures the new page needs, and testing those measures against the data before anyone builds a visual.
Ask for the plan first, keep report files off-limits, and limit writes to measures.
I want to add a report page that answers: how is each salesperson performing this year compared with last year, by region and by product?

Plan the page: the visuals, the fields each one uses, filters and slicers, and the layout. A screenshot of the existing Sales Overview page is attached so the new page can match its style.
Use existing measures where they fit. List any new measures the page needs, with their DAX, format strings and descriptions.

Don't create anything yet, and don't edit any report files. When I approve, create only the new measures through the PBIP folder connection, then export them to the TMDL files
Claude started from the data, not the layout. All seven active salespeople sell in every region and every product, so the plan uses two matrices. Salesperson by region and salesperson by product, instead of long slicer lists.
When comparing this year with last year, Claude found 10 salesperson-product combinations with sales in only one of the two: 4 are new this year, and 6 dropped to zero. Sales Metric YOY is blank for those, and small bases inflate the percentages elsewhere, for example, +1,469% on $1.3K. So the plan colors the matrices by dollar change and labels those cells “New” or “-100%” instead of leaving them blank.
The plan reuses the CY and LY measures, the year slicer, and the sidebar. It leaves out Top Performers, because the measure ranks region-employee pairs. It adds six measures in a Sales\Salesperson display folder.
| MEASURE | DESCRIPTION |
|---|---|
| Active Salespeople (CY) | Salespeople with sales in the selected year |
| Salespeople Growing YoY | Salespeople whose sales grew from the prior year |
| Top Salesperson (CY) | The top seller’s name, ranked across all regions |
| Top Salesperson Sales (CY) | That salesperson’s sales |
| Sales Change vs LY | Dollar change, counting a year with no sales as zero |
| Sales YoY Display | “+43%”, “-100%” or “New” for the matrix cells |
Before proposing the two matrix measures, Claude tested them as query-only measures. The net change across all salesperson-product cells came out to $24,700, which matches the ∆PY card on the Sales Overview.
After approving the plan, Claude created the six measures through the folder connection, exported them, and built a mock-up of the page using real This Year figures.
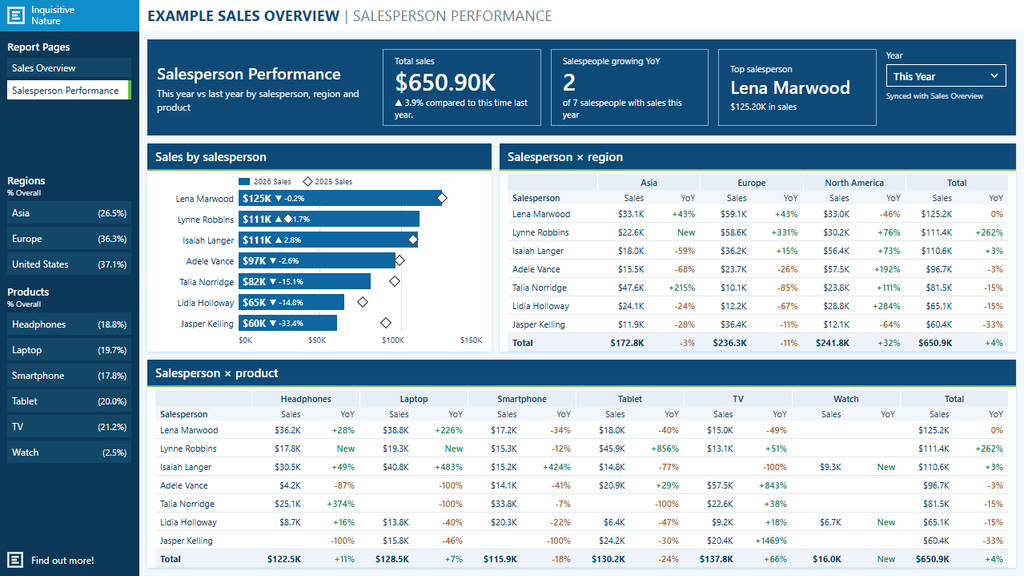
The mock-up is a design reference rendered in Claude Desktop, not a Power BI page. It helps settle the layout, the fields, expected values, and to gather feedback before starting to build the Power BI page. Then it provides a spec to create from rather than starting from scratch.
Using Claude to build the page itself is agent work, which is where the next post picks up.
Verify before you build. Apply the changes in Power BI Desktop, then ask Claude to evaluate each new measure by salesperson through the Desktop connection. The values matched the plan: 7 active, 2 growing, and Lena Marwood on top at $125.2K.
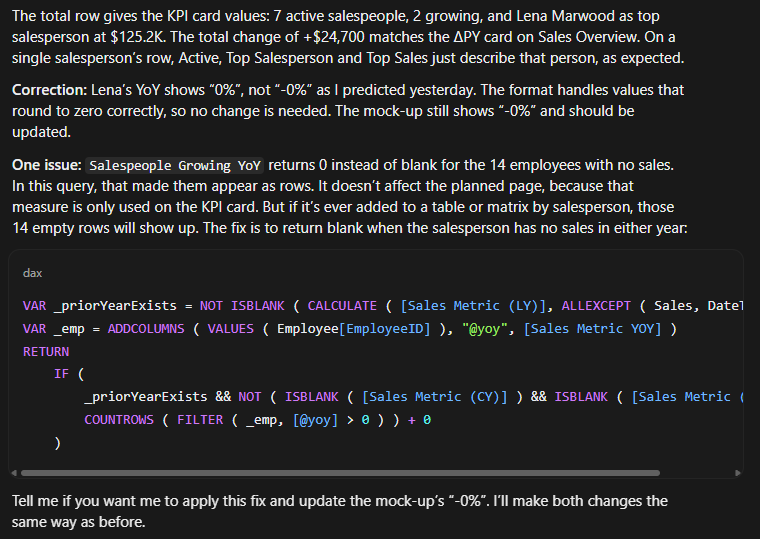
Claude also caught an error in its own mock-up: it had predicted Lena’s YoY label would read “-0%”, but Power BI Desktop returns “0%”.
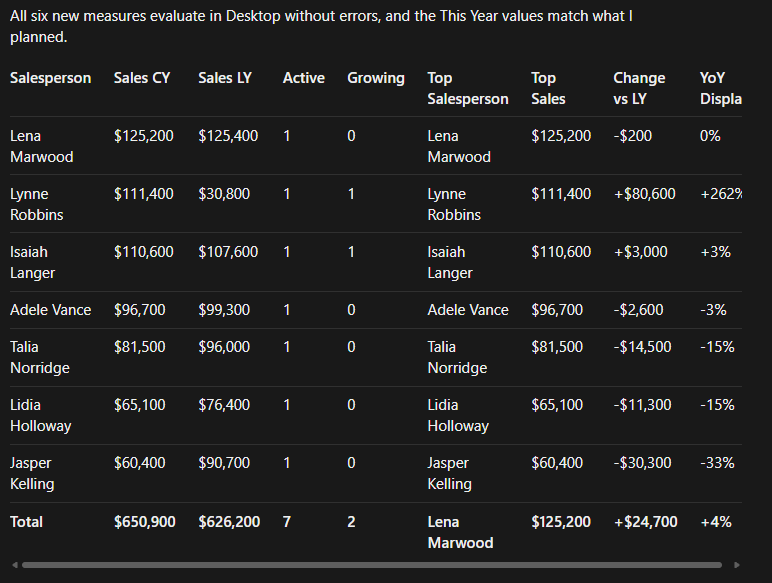
The same check found a real bug. Salespeople Growing YoY returned 0 instead of blank for the 14 employees with no sales, so they would show up as empty rows in any visual by salesperson.
Claude tested the fix in Power BI Desktop before applying it through the folder connection. The totals for every year were unchanged, and 2022 stays blank:
Salespeople Growing YoY =
VAR _priorYearExists =
    NOT ISBLANK(
       CALCULATE([Sales Metric (LY)], ALLEXCEPT(Sales, DateTable))
    )
VAR _emp =
    ADDCOLUMNS(VALUES(Employee[EmployeeID]), "@yoy", [Sales Metric YOY])

RETURN
    IF (
        _priorYearExists
        &&
        NOT (
           ISBLANK([Sales Metric (CY)]) && ISBLANK([Sales Metric (LY)])
        ),
        COUNTROWS(FILTER ( _emp, [@yoy] > 0)) + 0
    )
What to check: Treat the mock-up’s numbers as claims and confirm with a query as the verify step does. Read its design notes too. Here, Claude swapped the theme’s green and orange for darker shades because the originals don’t meet the 4.5.1 contrast standard for small text. That’s a choice for you to accept or reject when you build the page.
Guardrails
Claude Desktop’s approval prompt is the main control in this setup, but it has a limit. It catches a change you didn’t expect, not a change you approved that turns out to be wrong.
Back up before you start. Copy the project folder, or better, keep it in a git repo. Each export rewrites every file in the definition folder, so a git diff is the fastest way to see which file actually changed and to roll back a bad change.
Explore in read-only mode. Adding --readonly to the server’s args blocks every write. Use it when you only need to read a model, such as one you inherited. Remove it when you are ready to make changes.
Set tool permission by risk. Go to Settings > Customize > Connectors > powerbi-modeling-mcp. Every tool can be set to Always allow, Needs approval, or Blocked, one at a time or a whole group at once.
The read-only tools group has three: Connection Operations, DAX Query Operations, and Trace Operations. Setting this group to Always allow removes most of the approval clicks in the working loop, and nothing it allows can write. You can leave the 18 write/delete tools on Needs approval.
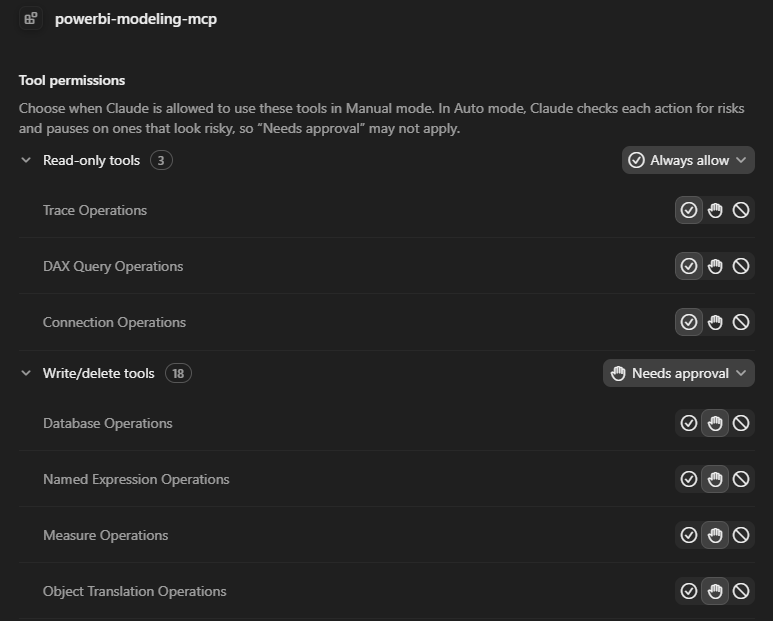
Two things to know before you change these settings:
- Choosing Always allow on a prompt in a chat changes this same setting. It applies to every chat from then on, not just the current one.
- Measure Operations handles reads and writes. Reading a measure back asks for approval, but allowing the tool also allows creating and deleting measures. Keep it Needs approval and approve the reads one at a time.
Know what leaves your machine. The MCP server runs locally, but everything it returns goes into the conversation: metadata, DAX expressions, and query results. All of it is sent to Anthropic as part of the chat.
As of writing this post, on Free, Pro, and Max plans, whether your chats can be used to train models is a privacy setting you control. On Team and Enterprise plans, Anthropic states it doesn’t train on your data by default (Anthropic’s data usage policy). You’re responsible for making sure your use of Claude follows your organization’s AI usage and data policies, so check them before you connect Claude to a model with your organization’s data.
When to Use Claude vs Copilot
Copilot still has its place. For a single measure, a quick explanation of a visual, or a question about the open report, it’s already in Power BI Desktop, as long as your organization has it turned on. The first two posts in this series cover what it does well.
Power BI AI Toolkit: Evaluating Copilot for DAX Development in Power BI Desktop
If you have ever felt that slight surge of hope when clicking the Copilot button in Power BI Desktop, you are not alone.
Power BI AI Toolkit: Build Better Reports Faster with Copilot
Exploring how to use Power BI Copilot to design report pages, generate visuals, and explore data without leaving the tool.
Licensing may decide what tool to use for you. As of writing this post, Copilot requires a workspace on a paid Fabric capacity (F2 or higher), a Premium capacity (P1 or higher), or a Fabric Copilot capacity (Copilot requirements). The local MCP server works against Power BI Desktop and PBIP files with no capacity requirement, but you pay for a Claude plan instead.
Copilot in DAX query view helped explain what the Top Performers measure does. Claude went further: it tested the measure against the data, found that it ranks region-employee pairs, and used that finding later to keep it off a page where it would have shown the wrong top seller.
If the answer depends on one measure, Copilot is enough. If it depends on the data or the whole model, the MCP server is a step ahead.
Wrap-Up
Copilot’s year-over-year measure came with a note about the date table. Here, Claude found the date table missing, rebuilt it, and verified that the 23 broken measures evaluate again, with your approval before each change.
That’s the practical case for Power BI AI-assisted development at this middle tier: Claude assisted with the reading, drafting, and testing, and you keep the approvals and the final check in Power BI Desktop.
The next post goes a step further. An agent in Claude Code, using Microsoft’s powerbi-authoring plugin, takes the Salesperson Performance plan and builds the report page itself.
Thank you for reading! Stay curious, and until next time, happy learning.

And, remember, as Albert Einstein once said, “Anyone who has never made a mistake has never tried anything new.” So, don’t be afraid of making mistakes, practice makes perfect. Continuously experiment, explore, and challenge yourself with real-world scenarios.
If this sparked your curiosity, keep that spark alive and check back frequently. Better yet, be sure not to miss a post by subscribing! With each new post comes an opportunity to learn something new.

Leave a Reply