Explore how to deliver personalized insights without losing the bigger picture.
This post is part two of a series on Power BI security patterns. Check out part one for a beginner-friendly overview of row-level security in Power BI.

Power BI Row-Level Security Explained: Protect Data by User Role
Discover how to personalize your reports and show each user only the data they require in just a few clicks.
This post will take our security design pattern one step further.
While row-level security (RLS) allows us to restrict data based on user roles and identities, there are times when we don’t want everything locked down. Occasionally, users need to see their data in relation to broader metrics, such as company-wide totals or averages.
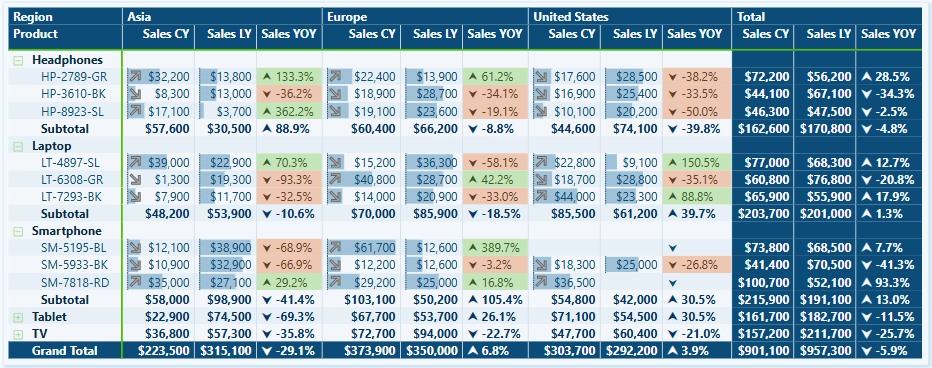
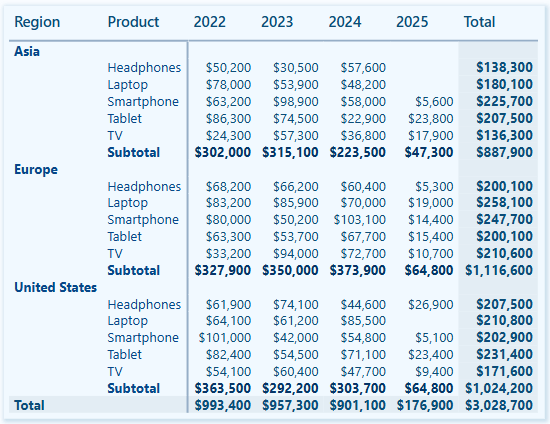
In the sample report, regional sales teams should see detailed information only about their assigned region and the total sales for other regions.
In the previous post, we noted that standard RLS filters out other regional sales, preventing the totals from other regions from being displayed. This is where partial RLS becomes useful and can fulfill this requirement.
In this post, we will walk through:
- What Partial RLS is and when to use it
- A real-world scenario that calls for it
- Key limitations and design tips
What is Partial Row-Level Security
Row-Level Security (RLS) applies filters at the dataset level throughout the entire datamodel for a user. This means that if RLS restricts a user to view only sales data for the North America region, every visual and measure in the report will be automatically limited to data associated with the North America region.
Using RLS is effective for data protection, but it can be a limitation when a report needs to provide a broader context to the user.
With report-level filters and slicers, DAX provides functions like ALL() and REMOVEFILTERS(), which can bypass data filtering. However, DAX expressions cannot bypass RLS.
Partial RLS is a design approach in Power BI that helps mitigate RLS’s limitations when necessary. The concept involves separating secured data from summary data, allowing users to view filtered and unfiltered insights side by side.
To achieve this, we will create a summary table (Annual Sales Summary (Regional)) within our datamodel. This summary table will aggregate the total sales across all regions and will not be affected by RLS filters. It provides overall totals that offer essential context when needed, while the RLS still restricts access to detailed sales information within our sales table.

In our sample report, RLS is applied to the Region table, and the RLS filter propagates to the Sales table.
In the datamodel, filters applied to the Region table do not directly impact the rows in our summary table. This means that users can see the total aggregated sales for all regions while still having RLS filters applied to the detailed sales data.
Use Case: Display Regional Total Sales and Percentage of Company-Wide Sales
We are designing a Power BI report for a global sales team. Each regional sales team member should only be able to:
- View detailed transaction-level data for their assigned region
- See key metrics, like total sales for all regions, to provide a broader context
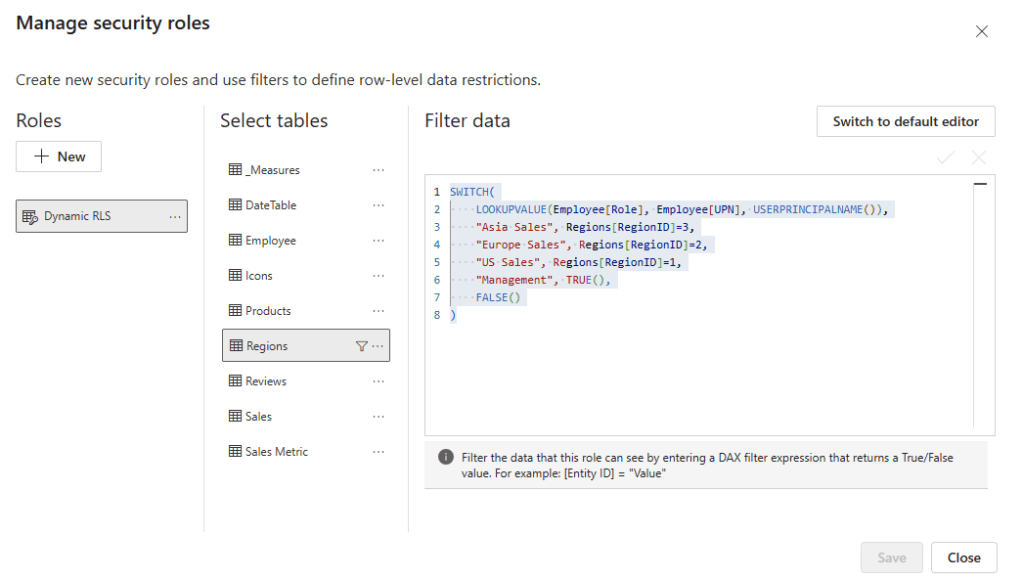
Step 1: Apply RLS rules to the Region table
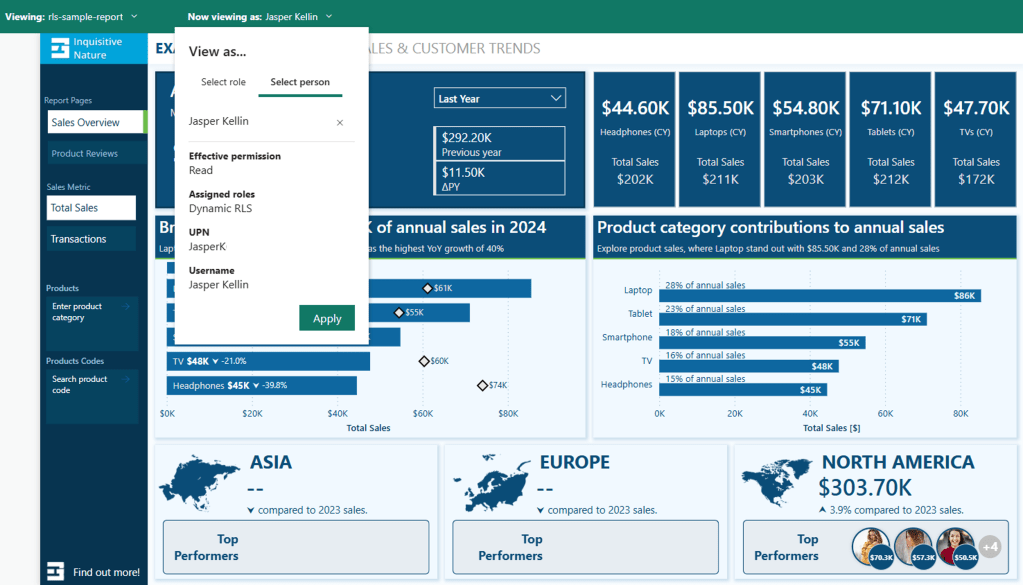
First, we define our RLS rules in Power BI Desktop, see Power BI Row-Level Security Explained: Protect Data by User Role.
The implemented RLS rules filter the Sales table and limits access to the appropriate region per user.

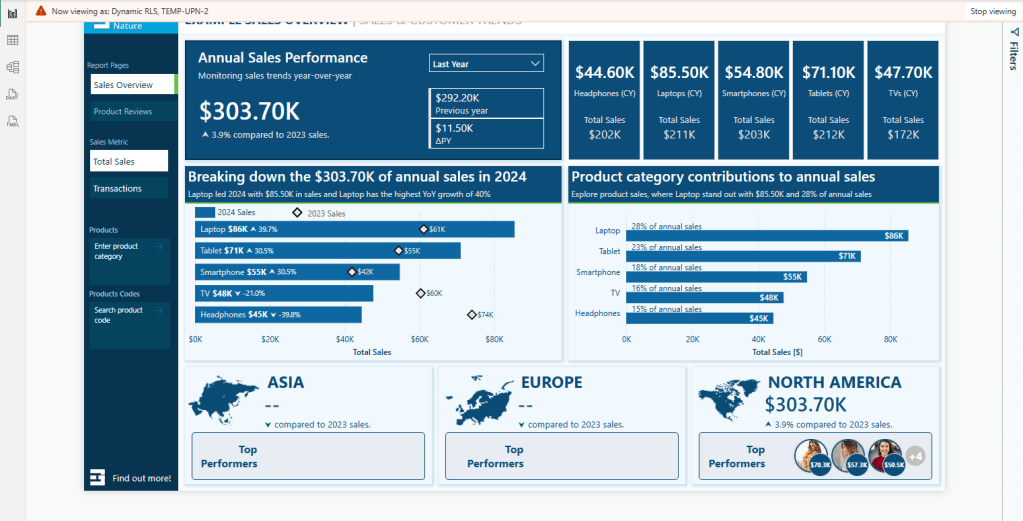
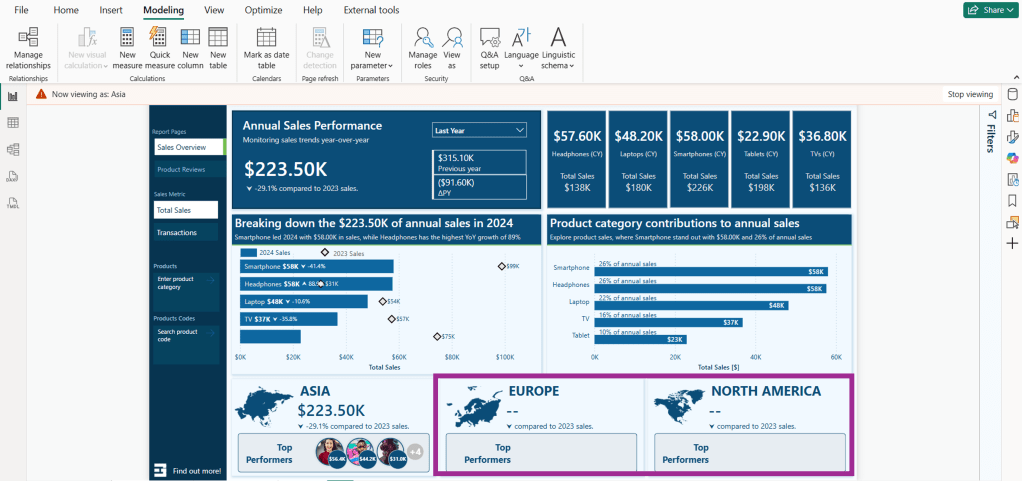
A challenge arises when we implement RLS while also trying to meet the second requirement. As shown in the image above, the total sales figures for Asia and North America appear blank when viewing the report with the Europe role.
This is because the measure used to calculate the totals uses the following expression.
Total Sales = SUM(Sales[Amount])When RLS is implemented, users only have access to data specific to their region. For instance, when the Total Sales measure is evaluated, the Sales table is filtered to include only the sales data associated with the Europe sales region. As a result, the Total Sales measure reflects the total sales relevant to the user’s region rather than the entire dataset.
Step 2: Create a summary table
To address this issue and meet our requirements, we will create a calculated summary table in our data model. This table will store pre-aggregated total sales and total transactions by year and region.
Annual Sales Summary (Regional) =
   SUMMARIZECOLUMNS(
      Sales[SalesDate].[Year],
      Regions[Region],
      "TotalRegionalSales", SUM(Sales[Amount]),
      "TotalRegionalTransactions", COUNTROWS(Sales),
      "DateKey", FORMAT(DATE(MAX(Sales[SalesDate].[Year]), 12, 31), "YYYYMMDD")
)
This table does not have a direct relationship with the Region table, which is under RLS control, and our RLS roles will not filter it.

Step 3: Build dynamic DAX measures
We can now utilize this table in our measures to establish company-wide or cross-region metrics while ensuring the security of the underlying transactional data.
We first create two new measures within our datamodel to calculate the entire company’s total sales and transaction counts.
Total Sales (nonRLS) =
SUM('Annual Sales Summary (Regional)'[TotalRegionalSales])

Transaction Count (nonRLS) =
SUM('Annual Sales Summary (Regional)'[TotalRegionalTransactions])
We can use these base measures to dynamically display total sales or total transactions for all regions in the data cards at the bottom of the report, utilizing the following expression and visual filters.
Regional Total Sales =
VAR _currentYear = YEAR(MAX(Sales[SalesDate]))
VAR _selectedMetric = SELECTEDVALUE('Sales Metric'[Sales Metric Fields])

RETURN
If(
    _selectedMetric = "'_Measures'[Total Sales]",
    CALCULATE(
        [Total Sales (nonRLS)],
        'Annual Sales Summary (Regional)'[Year]=_currentYear),
    CALCULATE(
        [Transation Count (nonRLS)],
        'Annual Sales Summary (Regional)'[Year]=_currentYear)
)
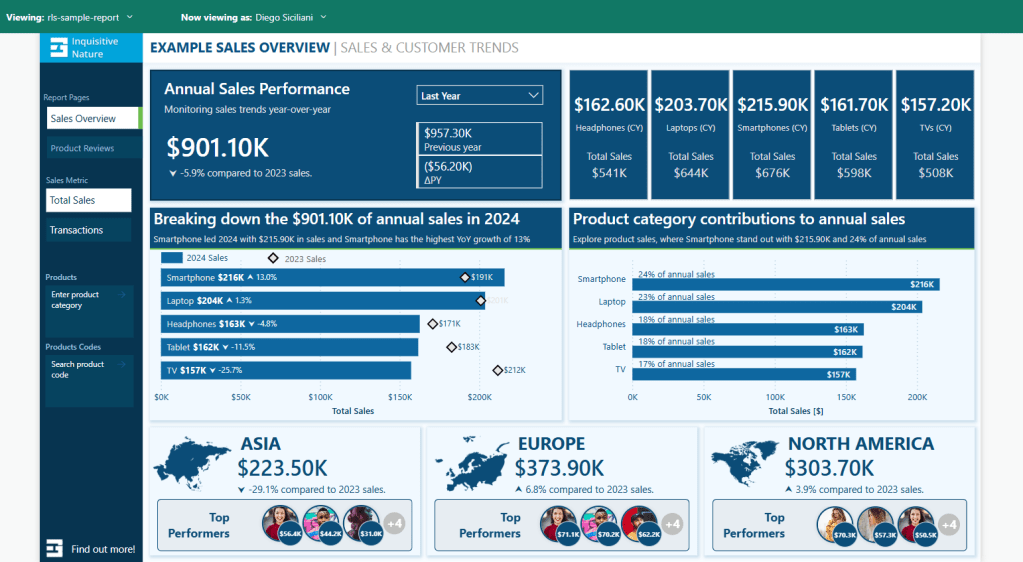
Note: we can also use the fact that RLS filters the region table and expressions such as COUNTROWS() or SELECTEDVALUE() to hide or show the top performers data card.
RLS still applies to the top-row visuals and bar charts, which provide detailed breakdowns of regional sales. However, the summary table enables us to present the total sales for all regions within the data card along the bottom of our report.
Step 4: Combine RLS-filtered and unfiltered measures
The non-RLS base measures can also compare regional total sales or transactions based on the current user (RLS-filtered) as a percentage of the company-wide measure (unfiltered).
% of CompanyWide Sales =
DIVIDE([Total Sales], [Total Sales (nonRLS)])
Considerations and Limitations
While the partial RLS pattern can enhance the usability and insightfulness of our Power BI report, we must consider its capabilities and limitations, as well as the associated technical and design trade-offs.
Partial RLS does not override existing RLS filters; instead, it isolates high-level summary data in a separate table unaffected by these filters. This allows partial RLS to be used for comparisons or to add additional global context without exposing detailed row-level information.
1) When implementing partial RLS, it’s important to remember that datamodel relationships matter. The summary table must be included in the datamodel to ensure that cross-filtering from tables affected by RLS does not impact it. If the summary table is related to a table with RLS filters applied at the datamodel level, it will also be subject to the RLS filters.
2) When combining measures filtered by RLS with unfiltered measures, users may need assistance interpreting the visuals associated with these measures. Visual cues or proper labeling, such as Total Sales Across All Regions versus Your Regional Sales may be necessary to help clarify what users are seeing.
3) Partial RLS can be implemented efficiently when the summary table is small and pre-aggregated without complex DAX filtering. However, keep in mind that if the summary table grows too large or includes too much granularity, it may negatively impact the performance of our reports.
4) Implementing partial RLS can add complexity when creating DAX measures. Since RLS is enforced on our Sales table, any attempts to calculate totals, even when using functions like ALL() or REMOVEFILTER(), will still be subject to our RLS rules. While partial RLS offers additional insights into our data, it does not grant any additional access.
5) We must assess edge cases, such as data gaps or undefined user roles. If a user is assigned a role that is not properly mapped in our datamodel, they may encounter an empty report or access to detailed data. We should always validate our RLS roles to ensure they function as expected.
Wrapping Up
Partial RLS is a design approach used in cases where RLS filtering restricts our ability to give users a broader context for their data. This approach allows us to ensure secure access to detailed, role-specific data while providing users insight into the overall picture and how their data fits into a larger context.
We can provide contextual insights without revealing specific row details by utilizing partial row-level security, enabling us to create more comprehensive and insightful reports.
Row-Level Security (RLS) enables us to filter data at the row level, but it does not allow us to secure entire tables or columns within our datamodel. Make sure to check back for the next post, or better yet, subscribe so you don’t miss it!
In the next post, we will explore Object-Level Security (OLS) in Power BI. OLS is essential because it allows us to secure specific tables and columns from report viewers.
If you’d like to follow along and practice these techniques, Power BI sample reports are available here: EMGuyant GitHub – Power BI Security Patterns.
Thank you for reading! Stay curious, and until next time, happy learning.

And, remember, as Albert Einstein once said, “Anyone who has never made a mistake has never tried anything new.” So, don’t be afraid of making mistakes, practice makes perfect. Continuously experiment, explore, and challenge yourself with real-world scenarios.
If this sparked your curiosity, keep that spark alive and check back frequently. Better yet, be sure not to miss a post by subscribing! With each new post comes an opportunity to learn something new.