A Guide to Transforming Data into Meaningful Metrics: Explore Essential Aggregation Functions
Welcome to another insightful journey of data analysis with Power BI. This guide is crafted to assist you in enhancing your skills no matter where you are in your DAX and Power BI journey through practical DAX function examples.
As you explore this content, you will discover valuable insights into effective Power BI reporting and develop strategies that optimize your data analysis processes. So, prepare to dive into the realm of DAX Aggregation functions.
- Unraveling the Mystery of Aggregation in DAX
- SUMming It Up: The Power of Basic Aggregations
- Understanding DAX Iterators: The X Factor in Aggregations
- AVERAGEx Marks the Spot: Advanced Insights with Average Functions
- COUNTing on Data: The Role of Count Functions in DAX
- MAXimum Impact: Extracting Peak Value with MAX and MAXX
- MINing for Gold: Uncovering Minimum Values with DAX
- Blending Aggregates and Filters: The Power Duo
- Navigating Pitfalls: Common Mistakes and How to Avoid Them
- Mastering Aggregation for Impactful Analysis
Unraveling the Mystery of Aggregation in DAX
Aggregation functions in DAX are essential tools for data analysis. They allow us to summarize and interpret large amounts of data efficiently. Let’s start by first defining what we mean when we talk about aggregation.
Aggregation is the process of combining multiple values to yield a single summarizing result. In the realms of data analysis, this typically involves calculating sums, averages, counts, and more to extract meaningful patterns and trends from our data.
Why is aggregation so important? The goal of our analysis and repots is to facilitate data-driven decision-making and quick and accurate data summarization is key. Whether we are analyzing sales data, customer behavior, or employee productivity, aggregation functions in DAX provide us a streamlined path to the insights we require. These functions enable us to distil complex datasets into actionable information, enhancing the effectiveness of our analysis.
As we explore various aggregation functions in DAX throughout this post, we will discover how to leverage these tools to transform data into knowledge. Get ready to dive deep into each function to first understand it and then explore practical examples and applications.
For those of you eager to start experimenting there is a Power BI report-preloaded with the same data used in this post ready for you. So don’t just read, follow along and get hands-on with DAX in Power BI. Get a copy of the sample data file here:

GitHub – Power BI DAX Function Series: Mastering Data Analysis
This dynamic repository is the perfect place to enhance your learning journey.
SUMming It Up: The Power of Basic Aggregations
SUM
When it comes to aggregation functions, SUM is the foundational member. It is straightforward and common but don’t underestimate its power. The SUM function syntax is simple as well.
SUM(column)
The argument column is the column of values that we want to sum.
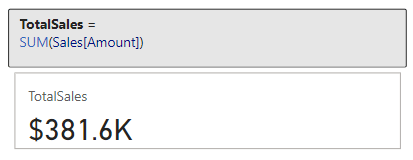
Let’s put this function to work with our sample dataset. Suppose we need to know the total sales amount. We can use the SUM function and the Amount column within our Sales Table to create a new TotalSales measure.
TotalSales =
SUM(Sales[Amount])
This measure quickly calculates the total sales across the entire dataset.
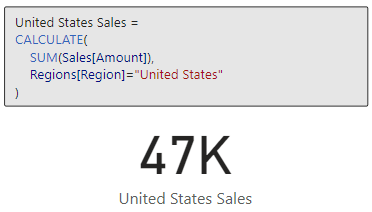
However, the utility of SUM goes beyond just tallying totals. It can be instrumental in uncovering deeper insights within our data. For a more advanced application, let’s analyze the total sales for a specific product category in a specific sales region. We can do this by combining SUM with the CALCULATE function, here is how the measure would look.
US Smartphone Sales =
CALCULATE (
   [TotalSales],
   Products[Product] = "Smartphone",
   Regions[Region] = "United States"
)
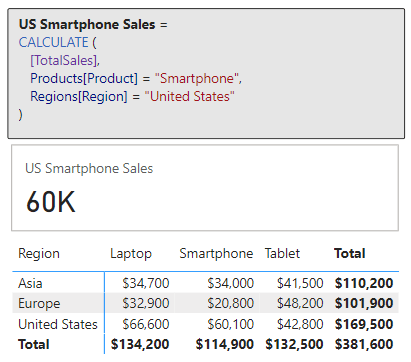
The measure sums up sales amounts exclusively for smartphones in the United Sales. For additional and more complex practical applications of SUM, for example calculating cumulative sales over time, continue your exploration with the examples in the following posts.

Unlocking the Secrets of CALCULATE: A Deep Dive into Advanced Data Analysis in Power BI
Demystifying CALCULATE: An exploration of advanced data manipulation.

DAX Filter Functions: Navigating the Data Maze with Ease
Discover how to effortlessly navigate through intricate data landscapes using DAX Filter Functions in Power BI.
The beauty and power of SUM lies in its simplicity and versatility. It is a starting point for deeper analysis, and commonly serves as a steppingstone towards more complex functions and insights. As we get more comfortable with SUM we will soon find it to be an indispensable part of our analytical approach in Power BI.
Understanding DAX Iterators: The X Factor in Aggregations
Before we continue diving deeper, if we review the aggregation function reference, we will notice several aggregation functions ending with X.

DAX Function Reference – Aggregation Functions
Learn more about: Aggregation Functions
These are examples of iterator functions in DAX and include functions such as SUMX, AVERAGEX, MAXX, MINX, and COUNTX. Understanding the distinction between these functions and their non-iterative counterparts like SUM is crucial for advanced data analysis.
Iterator functions are designed to perform row-by-row computations over a table (i.e. iterate over the table). In contrast to standard aggregations that operate on a column, iterators apply a specific calculation to each row, making them more flexible and powerful in certain scenarios.
In other words, SUM will provide us the total of a column while SUMX provides the total of an expression evaluated for each row. This distinction is key in scenarios where each row’s data needs individual consideration before aggregating to a final result.
For more in-depth insights into the powerful capabilities of DAX iterator functions, explore this in-depth post.

Power BI Iterators: Unleashing the Power of Iteration in Power BI Calculations
Iterator Functions — What they are and What they do
AVERAGEx Marks the Spot: Advanced Insights with Average Functions
AVERAGEX
Let’s explore an aggregation iterator function with AVERAGEX. This function is a step up from our basic average. As mentioned above, since it is an iterator function it calculates an expression for each row in a table and then calculates the average (arithmetic mean) of these results. The syntax for AVERAGEX is as follows:
AVERAGEX(table, expression)
Here, table is the table or an expression that specifies the table over which the aggregation is performed. The expression argument is the expression which will be evaluated for each row of the table. When there are no rows in the table, AVERAGEX will return a blank value, while when there are rows but non meet the specified criteria, the function returns a value of 0.
Time to see it in action with an example. We are interested in finding the average sales made by each employee. We can create the following measure to display this information.
Employee Average Total Sales =
AVERAGEX(
   Employee,
   [TotalSales]
)
This measure evaluates our TotalSales measure for each employee. The sales table is filtered by the EmployeeID, the employee’s total sales is calculated, then finally after all the employees totals sales are calculated the expression calculates the average.

In this above example, we can see the difference between AVERAGE and AVERAGEX. When we use the AVERAGE function this calculates the average of all the individual sale values for each employee, which is $3,855. The Employee Average Total Sales measure uses AVERAGEX and first calculates the total sales for each employee (Sum of Amount column), and then averages these total sales values returning an average total sales amount of $95,400.
What makes AVERAGEX particularly useful is its ability to handle complex calculations within the averaging process. It helps us understand the average result of a specific calculation for each row in our data. This can reveal patterns and insights that might be missed with basic averaging methods. AVERAGEX, and other iterators, are powerful tools in our DAX toolkit, offering nuanced insights into our data.
COUNTing on Data: The Role of Count Functions in DAX
The COUNT functions in DAX, such as COUNT, COUNTA, and DISTINCTCOUNT, are indispensable when it comes to understanding the frequency and occurrence of data in our dataset. These functions provide various ways to count items, helping us to quantify our data effectively.
COUNT
For our exploration of DAX counting functions, we will start with COUNT. As the name suggests, this function counts the number of non-blank values within the specified column. To count the number of blank values in a column check out the reference document for COUNTBLANK. The syntax for COUNT is shown below, where column is the column that contains the values to be counted.
COUNT(column)
If we want to get a count of how many sales transactions are recorded, we can create a measure with the expression below.
Sale Transaction Count =
COUNT(Sales[SalesID])
This new measure will provide the total number of sales transactions that have a sales id recorded (i.e. not blank).
The COUNT function counts rows that contain numbers, dates, or strings and when there are no rows to count the function will return a blank. COUNT does not support true/false data type columns, if this is required, we should use COUNTA instead.
When our goal is to count the rows in a table, it is typically better and clearer to use COUNTROWS. Keep reading to explore and learn more about COUNTA and COUNTROWS.
COUNTA
COUNTA expands on COUNT by counting all non-blank values in a column regardless of datatype. This DAX expression follows the same syntax as COUNT shown above.
In our Employee tables there is a true/false value indicating if the employee is a current or active employee. We need to get a count of this column, and if we use COUNT we will see the following error when we try to visual the Employee Active Column Count measure.
Employee Active Column Count =
COUNT(Employee[Active])

Since the Active column contains true/false values (i.e. boolean data type) we must use COUNTA to get a count of non-blank values in this column.
Employee Active Column Count =
COUNTA(Employee[Active])

Building on this measure we can use COUNTAX to get a current count of our active employees. We will create a new measure shown here.
Active Employee Count =
COUNTAX(
   FILTER(
      Employee,
      Employee[Active]=TRUE()
   ),
   Employee[Active]
)

Here we use COUNTAX, and for the table argument we use the FILTER function to filter the Employee table to only include employees whose Active status is true.
COUNTROWS
Next, we will look at COUNTROWS, which counts the number of rows in a table or table expression. The syntax is:
COUNTROWS([table])
Here, table is the table that contains the rows to be counted or an expression that returns a table. This argument is optional, and when it is not provided the default value is the home table of the current expression.
It is typically best to use COUNT when we are specifically interested in the count of values in the specified column, when it is our intention to count the rows of a table, we can use COUNTROWS. This function is more efficient and indicates the intention of the measure in a clearer manner.
A common use of COUNTROWS is to count the number of rows that result from filtering a table or applying context to a table. Let’s use this to improve our Active Employee Count measure.
Active Employee CountRows =
COUNTROWS(
   FILTER(
      Employee,
      Employee[Active]=TRUE()
   )
)

In this example it is recommended to use COUNTROWS because we are not specifically interested in the count of values in the Active column. Rather, we are interested in the number of rows in the Employee table when we filter the table to only include Active=true employees.
DISTINCTCOUNT
Adding to these, DISTINCTCOUNT is particularly useful for identifying the number of unique values in a column, with the following syntax.
DISTINCTCOUNT(column)
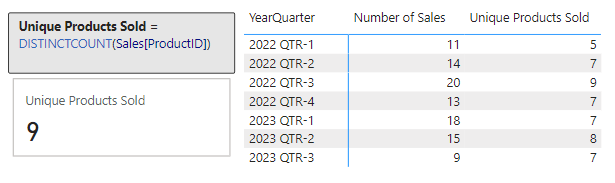
In our report we would like to examine the number of unique products sold within our dataset. To do this we create a new measure.
Unique Products Sold =
DISTINCTCOUNT(Sales[ProductID])
We can then use this to visual the number of unique Product Ids within our Sales table, and we can use this new measure to further examine the unique products sold broken down by year and quarter.
Together, DAX count functions provide a comprehensive toolkit for measuring and understanding the dimensions of our data in various ways.
MAXimum Impact: Extracting Peak Value with MAX and MAXX
In DAX, the MAX and MAXX functions are the tools to use for pinpointing peak performances, maximum sales, or any other type of highest value within in our dataset.
MAX
The MAX function is simple to use. It finds the highest numeric value in a specified column.
MAX(column)
The column argument is the column in which we want to find the largest value. The MAX function can also be used to return the largest value between to scalar expressions.
MAX(expression1, expression2)
Each expression argument is a DAX expression which returns a single value. When we are using MAX to compare two expressions, a blank value is treated as 0, and if both expressions return a blank value, MAX will also return a blank value. Similar to COUNT, true/false data types are not supported, and if we need to evaluate a column of true/false values we should use MAXA.
Let’s use MAX to find our highest sale amount.
Max Sale Amount =
MAX(Sales[Amount])
This new measures scans through the Amount column in our Sales table and returns the maximum value.

MAXX
MAXX builds on the functionality of MAX and offers more flexibility. It calculates the maximum value of an expression evaluated for each row in a table. The syntax follows the similar pattern as the other aggregation iterators.
MAXX(table, expression, [variant])
The table and expression arguments are the table containing the rows for which the expression will be evaluated, and the expression specifies what will be evaluated. The optional argument variant can be used when the expression has a variant or mixed value type, by default MAXX will only consider numbers. If variant is set to true, the highest value is based on ordering the column in descending order.
Let’s add some more insight to our Max Sale Amount measure. We will use MAXX to find the highest sales amount per product across all sales regions.
Max Product Total Sales =
MAXX(
   Products,
   [TotalSales]
)
This measure iterates over each product and calculates the totals sales amount for that product by evaluating our previously created TotalSales measure. After the total sales for each product is calculated the measure returns the highest total found across all products.

These functions provide us the tools to explore the maximum value within specific columns and also across different segments and criteria, enabling a more detailed and insightful understanding of our data’s maximum values.
MINing for Gold: Uncovering Minimum Values with DAX
The MIN and MINX functions help us discover the minimums in various scenarios, whether we are looking for the smallest sale or quantity, or any other type of lowest value.
MIN
MIN is straightforward, it finds the smallest numeric value in a column or, similar to MAX, the smallest value between two scalar expressions.
MIN(column)
MIN(expression1, expression2)
When comparing expressions, a blank value is handled the same as how the MAX function handles a blank value.
We have already identified the highest sale value, let’s use MIN to find our lowest sale amount.
Min Sale Amount =
MIN(Sales[Amount])
This measure checks all the values in the Amount column of the Sales table and returns the smallest value.

MINX
MINX, on the other hand, offers more complex analysis capabilities. It calculates the minimum value of an expression evaluated for each row in a table. Its syntax will look familiar and follows the same pattern as MAXX.
MINX(table, expression, [variant])
The arguments to MINX are the same as MAXX, see the previous section for details on each argument.
We used MAXX to find the maximum total product sales, in a similar manner let’s use MINX to find the lowest total sales by region.
Min Region Total Sales =
MINX(
   Regions,
   [TotalSales]
)
The Min Region Total Sales measure iterates over each region and calculates its total sales, then it identifies and returns the lowest totals sales value.

These functions are powerful and prove to be helpful in our data analysis. They allow us to find minimum values and explore these values across various segments and conditions. This helps us better understand the lower-end spectrum of our data.
Blending Aggregates and Filters: The Power Duo
Blending aggregation functions with filters in DAX allows for more targeted and nuanced data analysis. The combination of functions like CALCULATE and FILTER can provide a deeper understanding of specific subsets in our data.
CALCULATE is a transformative function in DAX that modifies the filter context of a calculation, making it possible to perform aggregated calculations over a filtered subset of data. CALCULATE is crucial to understand and proves to be helpful in many data analysis scenarios. For details on this function and plenty of examples blending aggregations functions with CALCULATE take a look at this in-depth post focused solely on this essential function.
Unlocking the Secrets of CALCULATE: A Deep Dive into Advanced Data Analysis in Power BI
Demystifying CALCULATE: An exploration of advanced data manipulation.
FILTER is another critical function that allows us to filter a table based on a given conditions. We used this function along with COUNTROWS to count the number of active employees. For additional examples and more details on FILTER and other filter functions see the post below.

DAX Filter Functions: Navigating the Data Maze with Ease
Discover how to effortlessly navigate through intricate data landscapes using DAX Filter Functions in Power BI.
Navigating Pitfalls: Common Mistakes and How to Avoid Them
Working with DAX in Power BI can be incredibly powerful, but it is not without its pitfalls. Being aware of common mistakes and understanding how to avoid them can save us time and help ensure our data analysis is as accurate and effective as possible.
One frequent mistake is misunderstanding context in DAX calculations. Remember, DAX functions operate within a specific context, which could be row context or filter context. Misinterpreting or not accounting for this can lead to incorrect results. For instance, using an aggregate function without proper consideration of the filter context can yield misleading totals or averages.
Another common issue is overlooking the differences between similar functions. For example, SUM and SUMX might seem interchangeable, but they operate quite differently. SUM aggregates values in a column, while SUMX performs row-by-row calculations before aggregating. Understanding these subtleties is crucial for accurate data analysis.
Lastly, we should always beware of performance issues with our reports. As our datasets grow, complex DAX expression can slow down our reports. We should look to optimize our DAX expressions by using appropriate functions and minimizing the use of iterative functions (like aggregations functions ending in X) when a simpler aggregation function would suffice.
Mastering Aggregation for Impactful Analysis
As we reach the conclusion of our exploration into DAX aggregation functions, it’s clear that mastering these tools is essential for impactful data analysis in Power BI. Aggregation functions can be the key to unlocking meaningful insights and making informed decisions.
Remember, the journey from raw data to actionable insights involves understanding not just the functions themselves, but also the context in which they are used. From the basic SUM to the more complex SUMX, each function has its place and purpose. The versatility of AVERAGEX and the precision of COUNT functions demonstrate the depth and flexibility of DAX.
Incorporating MAX and MIN functions helps us identify extremes in our datasets. Blending aggregations with the power of CALCULATE and FILTER shows the potential of context-driven analysis, enabling targeted investigations within our data.
The journey through DAX aggregation functions is one of continuous learning and application. As we become more comfortable with these tools, we will find ourselves able to handle increasingly complex data scenarios, making our insights all the more powerful and our decisions more data driven. Continue exploring DAX aggregation functions with the DAX Reference.
DAX Function Reference – Aggregation Functions
Learn more about: Aggregation Functions
Thank you for reading! Stay curious, and until next time, happy learning.

And, remember, as Albert Einstein once said, “Anyone who has never made a mistake has never tried anything new.” So, don’t be afraid of making mistakes, practice makes perfect. Continuously experiment and explore new DAX functions, and challenge yourself with real-world data scenarios.
If this sparked your curiosity, keep that spark alive and check back frequently. Better yet, be sure not to miss a post by subscribing! With each new post comes an opportunity to learn something new.