

Insights & Tutorials
Practical Power BI, Power Automate, and Microsoft 365 tutorials for practitioners who want to go further than just the basics.
ai ALM Automation Business Intelligence Business Process Modernization Data Analysis Data Analytics DataChallenge Data Visualization DAX DesignMeetsData DiveIntoDAX Excel Figma microsoft microsoft-fabric Microsoft 365 Microsoft Planner Microsoft Teams Model-Driven Apps Outlook Power Apps Power Apps Tutorial Power Automate Power Automate Tips Power BI powerbi Power BI Core Visuals Power BI Developer Power BI Feature Spotlight Power BI Functions Power BI Fundamentals Power BI Report De Power BI Report Design Power BI Tutorial Power Platform Power Query Process Automate Project Management ShaerPoint sharepoint Task Managem Task Management technology User Interface Design
-

Explore Power BI Core Visualizations: Part 1 – Bar and Column Charts
Chart your data journey! Transform data into insights with Power BI core visualizations. Overview of the…
-

Dive into DAX: Simplify Data Models with Relationship Functions
Learn the art of data modeling and how to enhance your analysis with DAX Relationship Functions.…
-
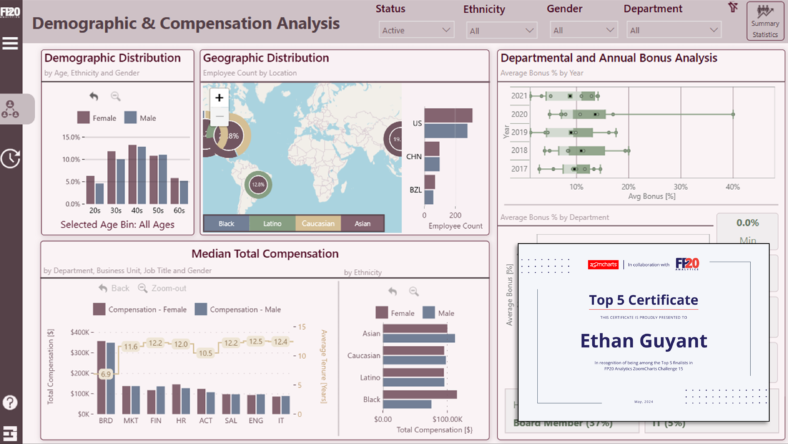
FP20 Analytics ZoomCharts Challenge 15: My Journey to the Top 5
Ever wondered how to tackle Power BI data challenges? Find out how I transformed this challenge…
-

Design Meets Data: Crafting Interactive Navigations in Power BI
User-Centric Design: Next level reporting with interactive navigation for an enhanced user experience. An essential aspect…
-
Dive into DAX: Decoding Data with Power BI Logical Functions
Bridge the gap between data chaos and clarity with the strategic use of Power BI Logical…
-
Design Meets Data: The Art of Crafting Captivating Power BI Themes
Dive into the details of blending design and data with custom Power BI themes. At the…
-
Dive into DAX: Elevated Insights with Information Functions
Navigate Data Complexities with Ease and Accuracy In data analytics effectively navigating, understanding, and interpreting our…
-
Design Meets Data: A Guide to Building Interactive Power BI Report Navigation
The post discusses the process of enhancing Power BI report navigation by leveraging Figma’s design capabilities.…
-
DAX Table Manipulation Functions: Transforming Your Data Analysis
Discover how to Reshape, Manipulate, and Transform your data into dynamic insights. Exploring DAX: Table Manipulation…
-

Power Apps Tips: Visually Distinguishing Your App’s Environment
The Art of Visual Cues: A Simple Yet Powerful Tool for Environment Identification Are you tired…
Categories
Archive
- June 2026
- April 2026
- September 2025
- July 2025
- May 2025
- April 2025
- March 2025
- February 2025
- January 2025
- December 2024
- November 2024
- October 2024
- September 2024
- August 2024
- July 2024
- June 2024
- May 2024
- April 2024
- March 2024
- February 2024
- January 2024
- December 2023
- November 2023
- October 2023
- September 2023
- August 2023
- July 2023
- June 2023
- May 2023
- April 2023
- January 2023
- December 2022
- November 2022
- October 2022
- September 2022
- August 2022