

Insights & Tutorials
Practical Power BI, Power Automate, and Microsoft 365 tutorials for practitioners who want to go further than just the basics.
ai ALM Automation Business Intelligence Business Process Modernization Data Analysis Data Analytics DataChallenge Data Visualization DAX DesignMeetsData DiveIntoDAX Excel Figma microsoft microsoft-fabric Microsoft 365 Microsoft Planner Microsoft Teams Model-Driven Apps Outlook Power Apps Power Apps Tutorial Power Automate Power Automate Tips Power BI powerbi Power BI Core Visuals Power BI Developer Power BI Feature Spotlight Power BI Functions Power BI Fundamentals Power BI Report De Power BI Report Design Power BI Tutorial Power Platform Power Query Process Automate Project Management ShaerPoint sharepoint Task Managem Task Management technology User Interface Design
-
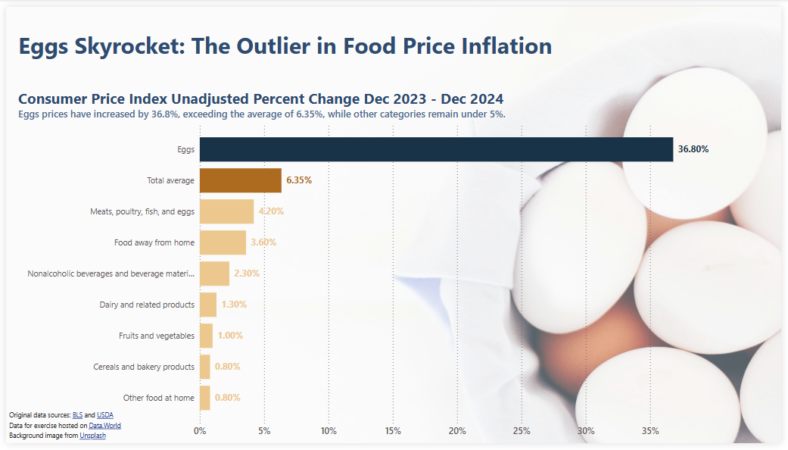
Enhancing Bar Charts in Power BI: A 2025 Workout Wednesday Challenge
Make your Power BI reports more impactful—learn how to highlight key data points in a bar…
-
Dive into DAX: Unlock the Full Potential of FORMAT
Learn how to create interactive, audience-friendly visuals with custom formatting and dynamic insights I recently participated…
-
Dive into DAX: Getting Started with DAX Query View
A Beginner’s Guide to Exploring Data Models with DAX Queries Getting Started with DAX Query View…
-

Power BI Feature Spotlight: Data Filtering and Modeling
Stay ahead of the latest features with a focused look at Power BI’s latest features, their…
-
Power BI Feature Spotlight: Marker Enhancements
Stay ahead of the latest features with a focused look at Power BI’s latest features, their…
-

Elevate Power Automate Error Handling with Centralized Failure Notifications
Learn how to create a dynamic failure notification framework across Teams channels with a centralized SharePoint…
-

Design Meets Data: A Guide to Building Engaging Power BI Report Navigation
Streamlined report navigation with built-in tools to achieve functional, maintainable, and engaging navigation in Power BI…
-

Explore Power BI Core Visualizations: Part 3 – Pie, Donut, and Treemap
Chart your data journey! Transform data into insights with Power BI core visualizations. Pie, Donut, and…
-

Power Query Functions: Building Flexible and Reusable Data Cleaning Routines
Enhancing Consistency and Efficiency with Customizable Power Query Workflows When extracting and transforming data in Power…
-

Explore Power BI Core Visualizations: Part 2 – Line and Area Charts
Chart your data journey! Transform data into insights with Power BI core visualizations. Welcome back to…
Categories
Archive
- June 2026
- April 2026
- September 2025
- July 2025
- May 2025
- April 2025
- March 2025
- February 2025
- January 2025
- December 2024
- November 2024
- October 2024
- September 2024
- August 2024
- July 2024
- June 2024
- May 2024
- April 2024
- March 2024
- February 2024
- January 2024
- December 2023
- November 2023
- October 2023
- September 2023
- August 2023
- July 2023
- June 2023
- May 2023
- April 2023
- January 2023
- December 2022
- November 2022
- October 2022
- September 2022
- August 2022